Sample Reports
These are sample reports generated by the Perception Survey web based data base. The sample reports provide summaries of numerous reports that are available such as survey respondent comments report, bench marking with peer companies in your industry and/or with your safety association (if applicable) and many more as indicated below.
Questions That do not Affect Scoring
Survey in 100 different Languages
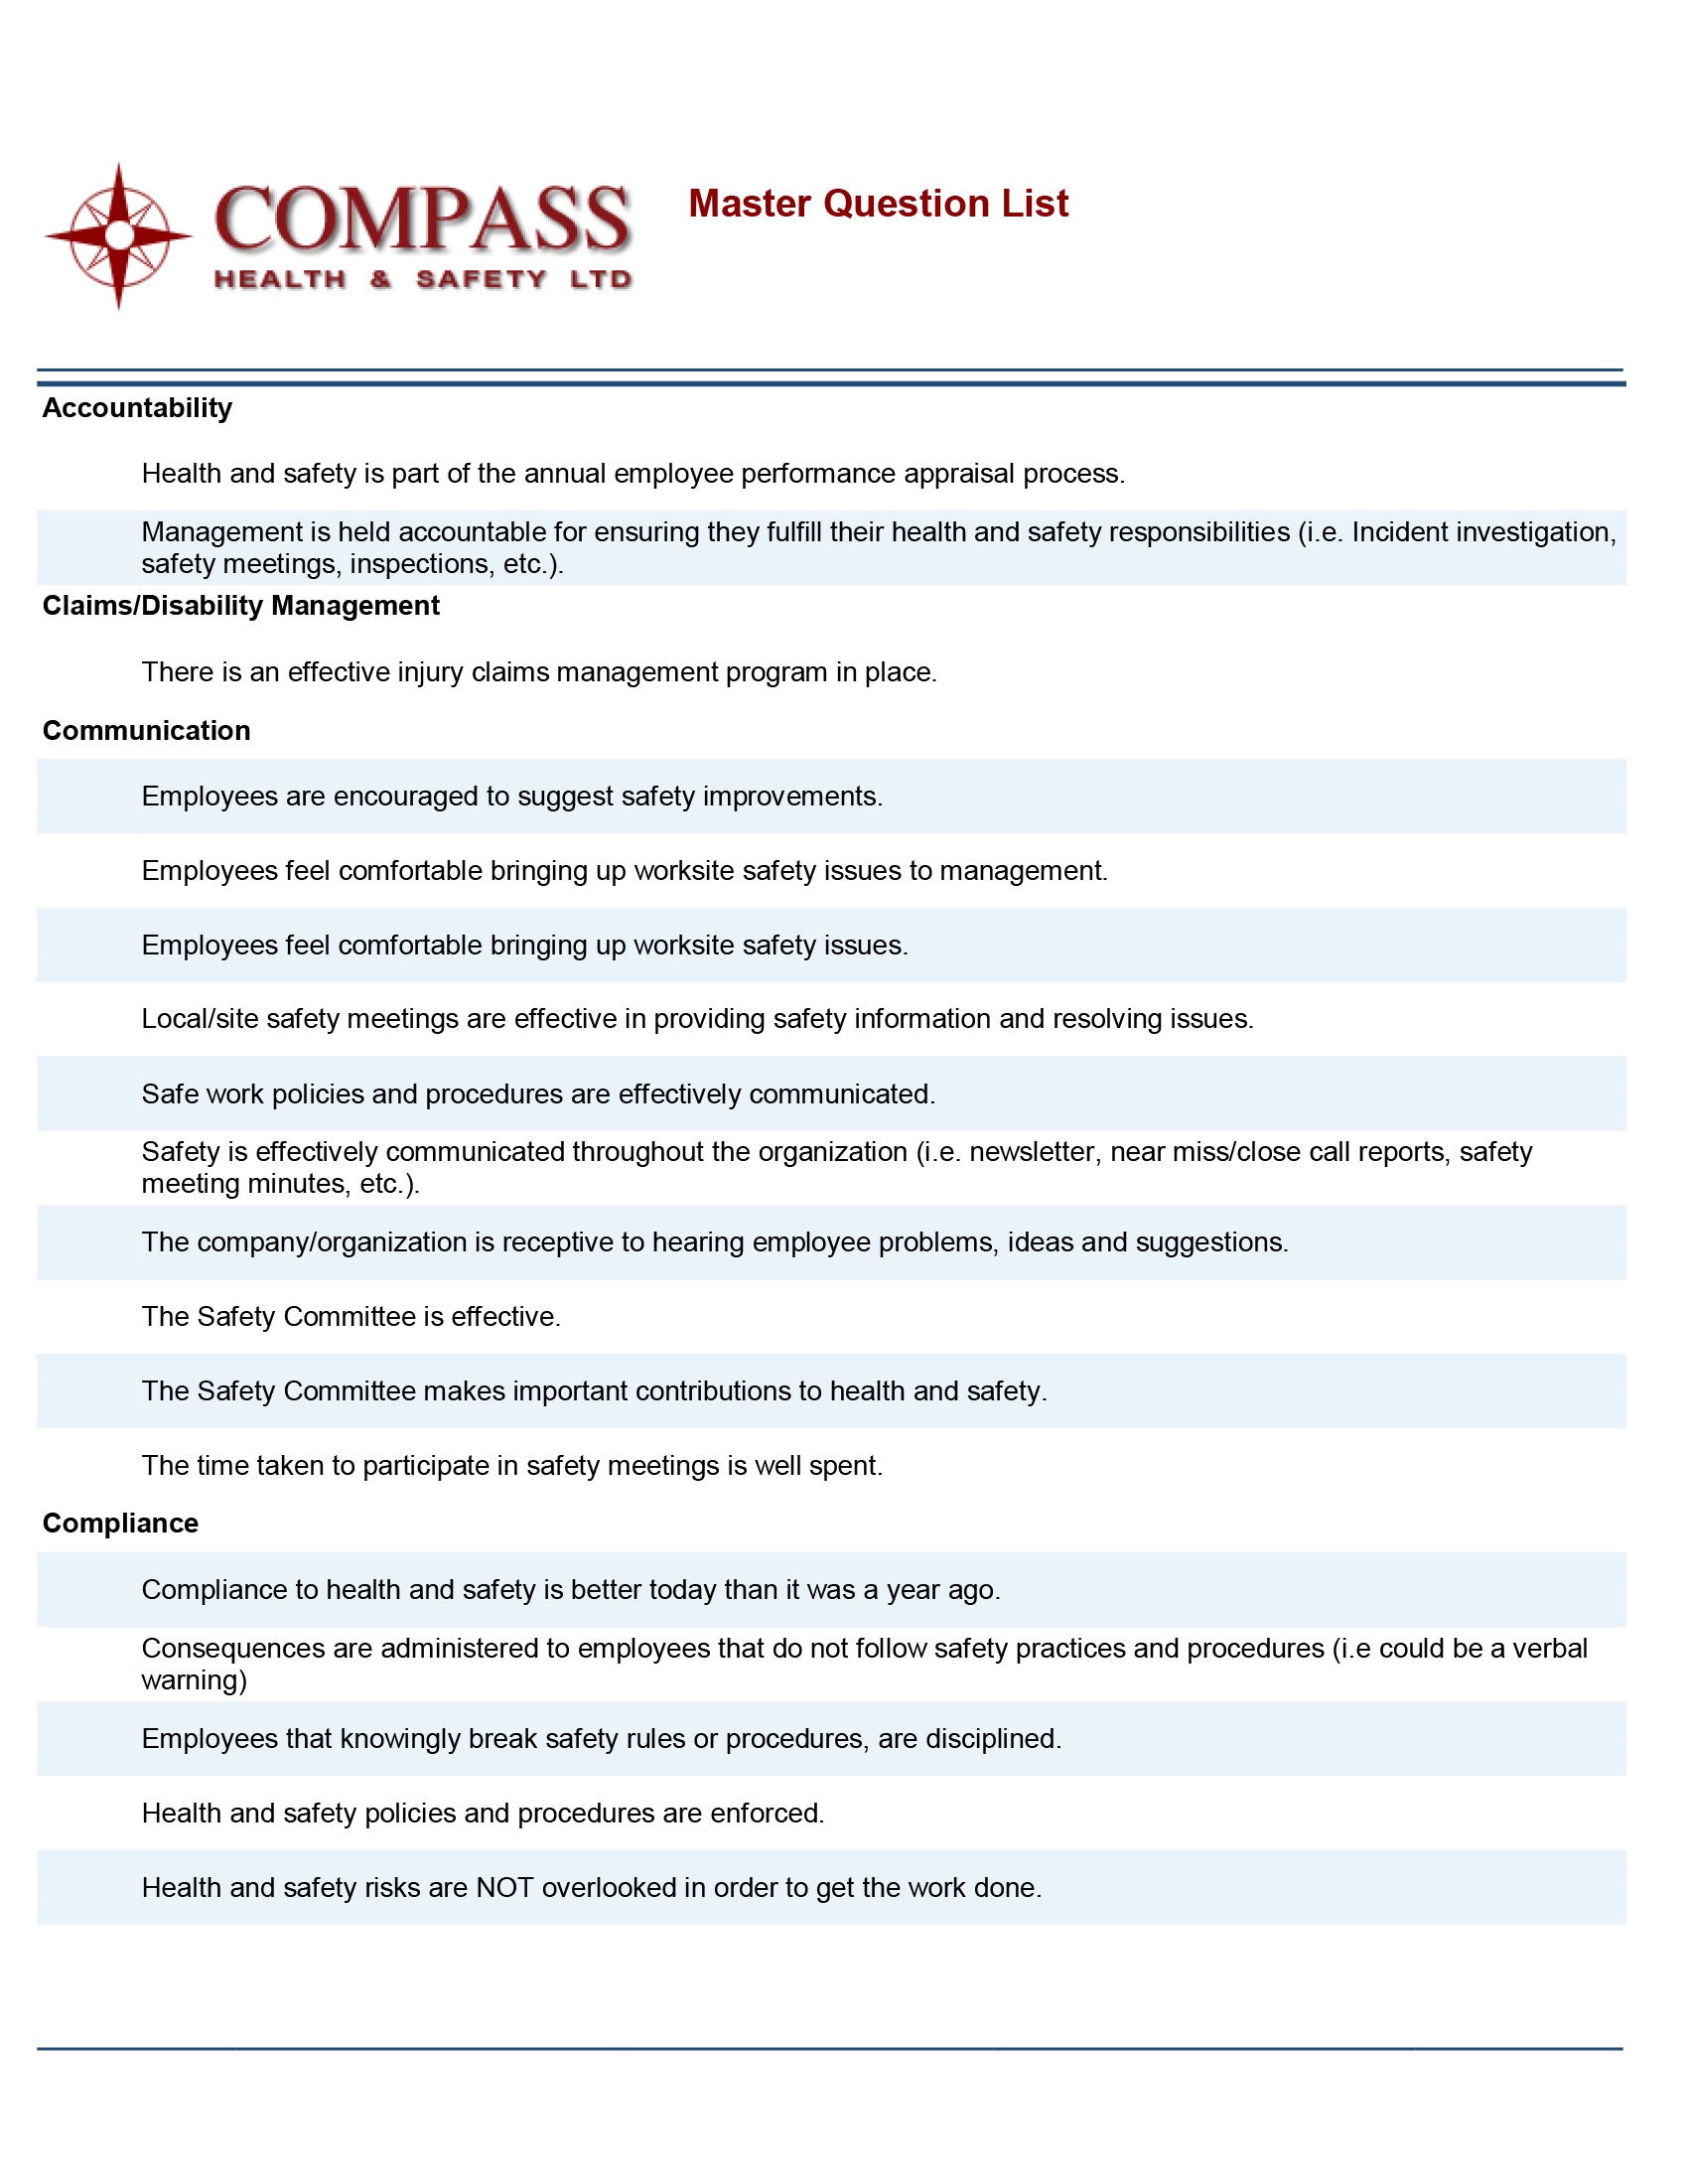
Master Question List
Choose an existing survey or start from scratch by selection from our master question list of over 150 health and safety survey questions. Modify them to suit your company needs, develop your own questions or select questions from another survey.
Reporting Parameters
Select how you want your data to sort and print out. You can select a number of reporting parameters to present the data in a way that is most meaningful to your company. The reporting parameters may be unique to your company. You can select to report by location, position, gender, age, all of these parameters or others?

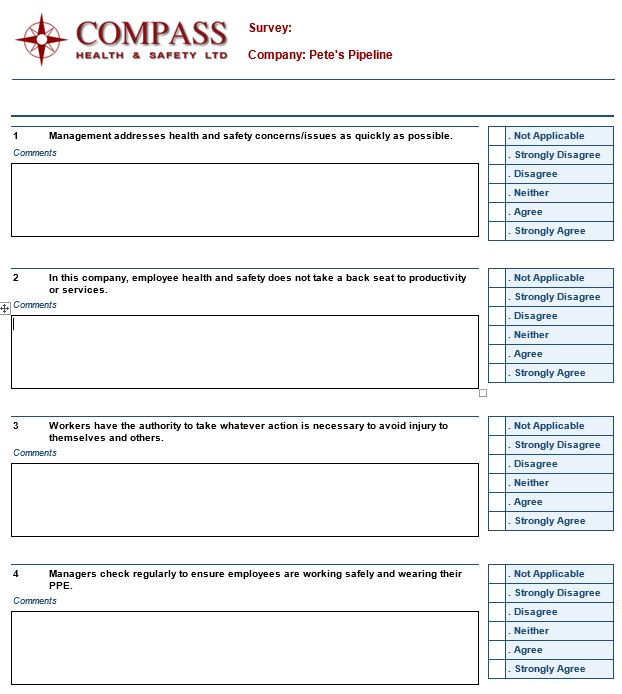
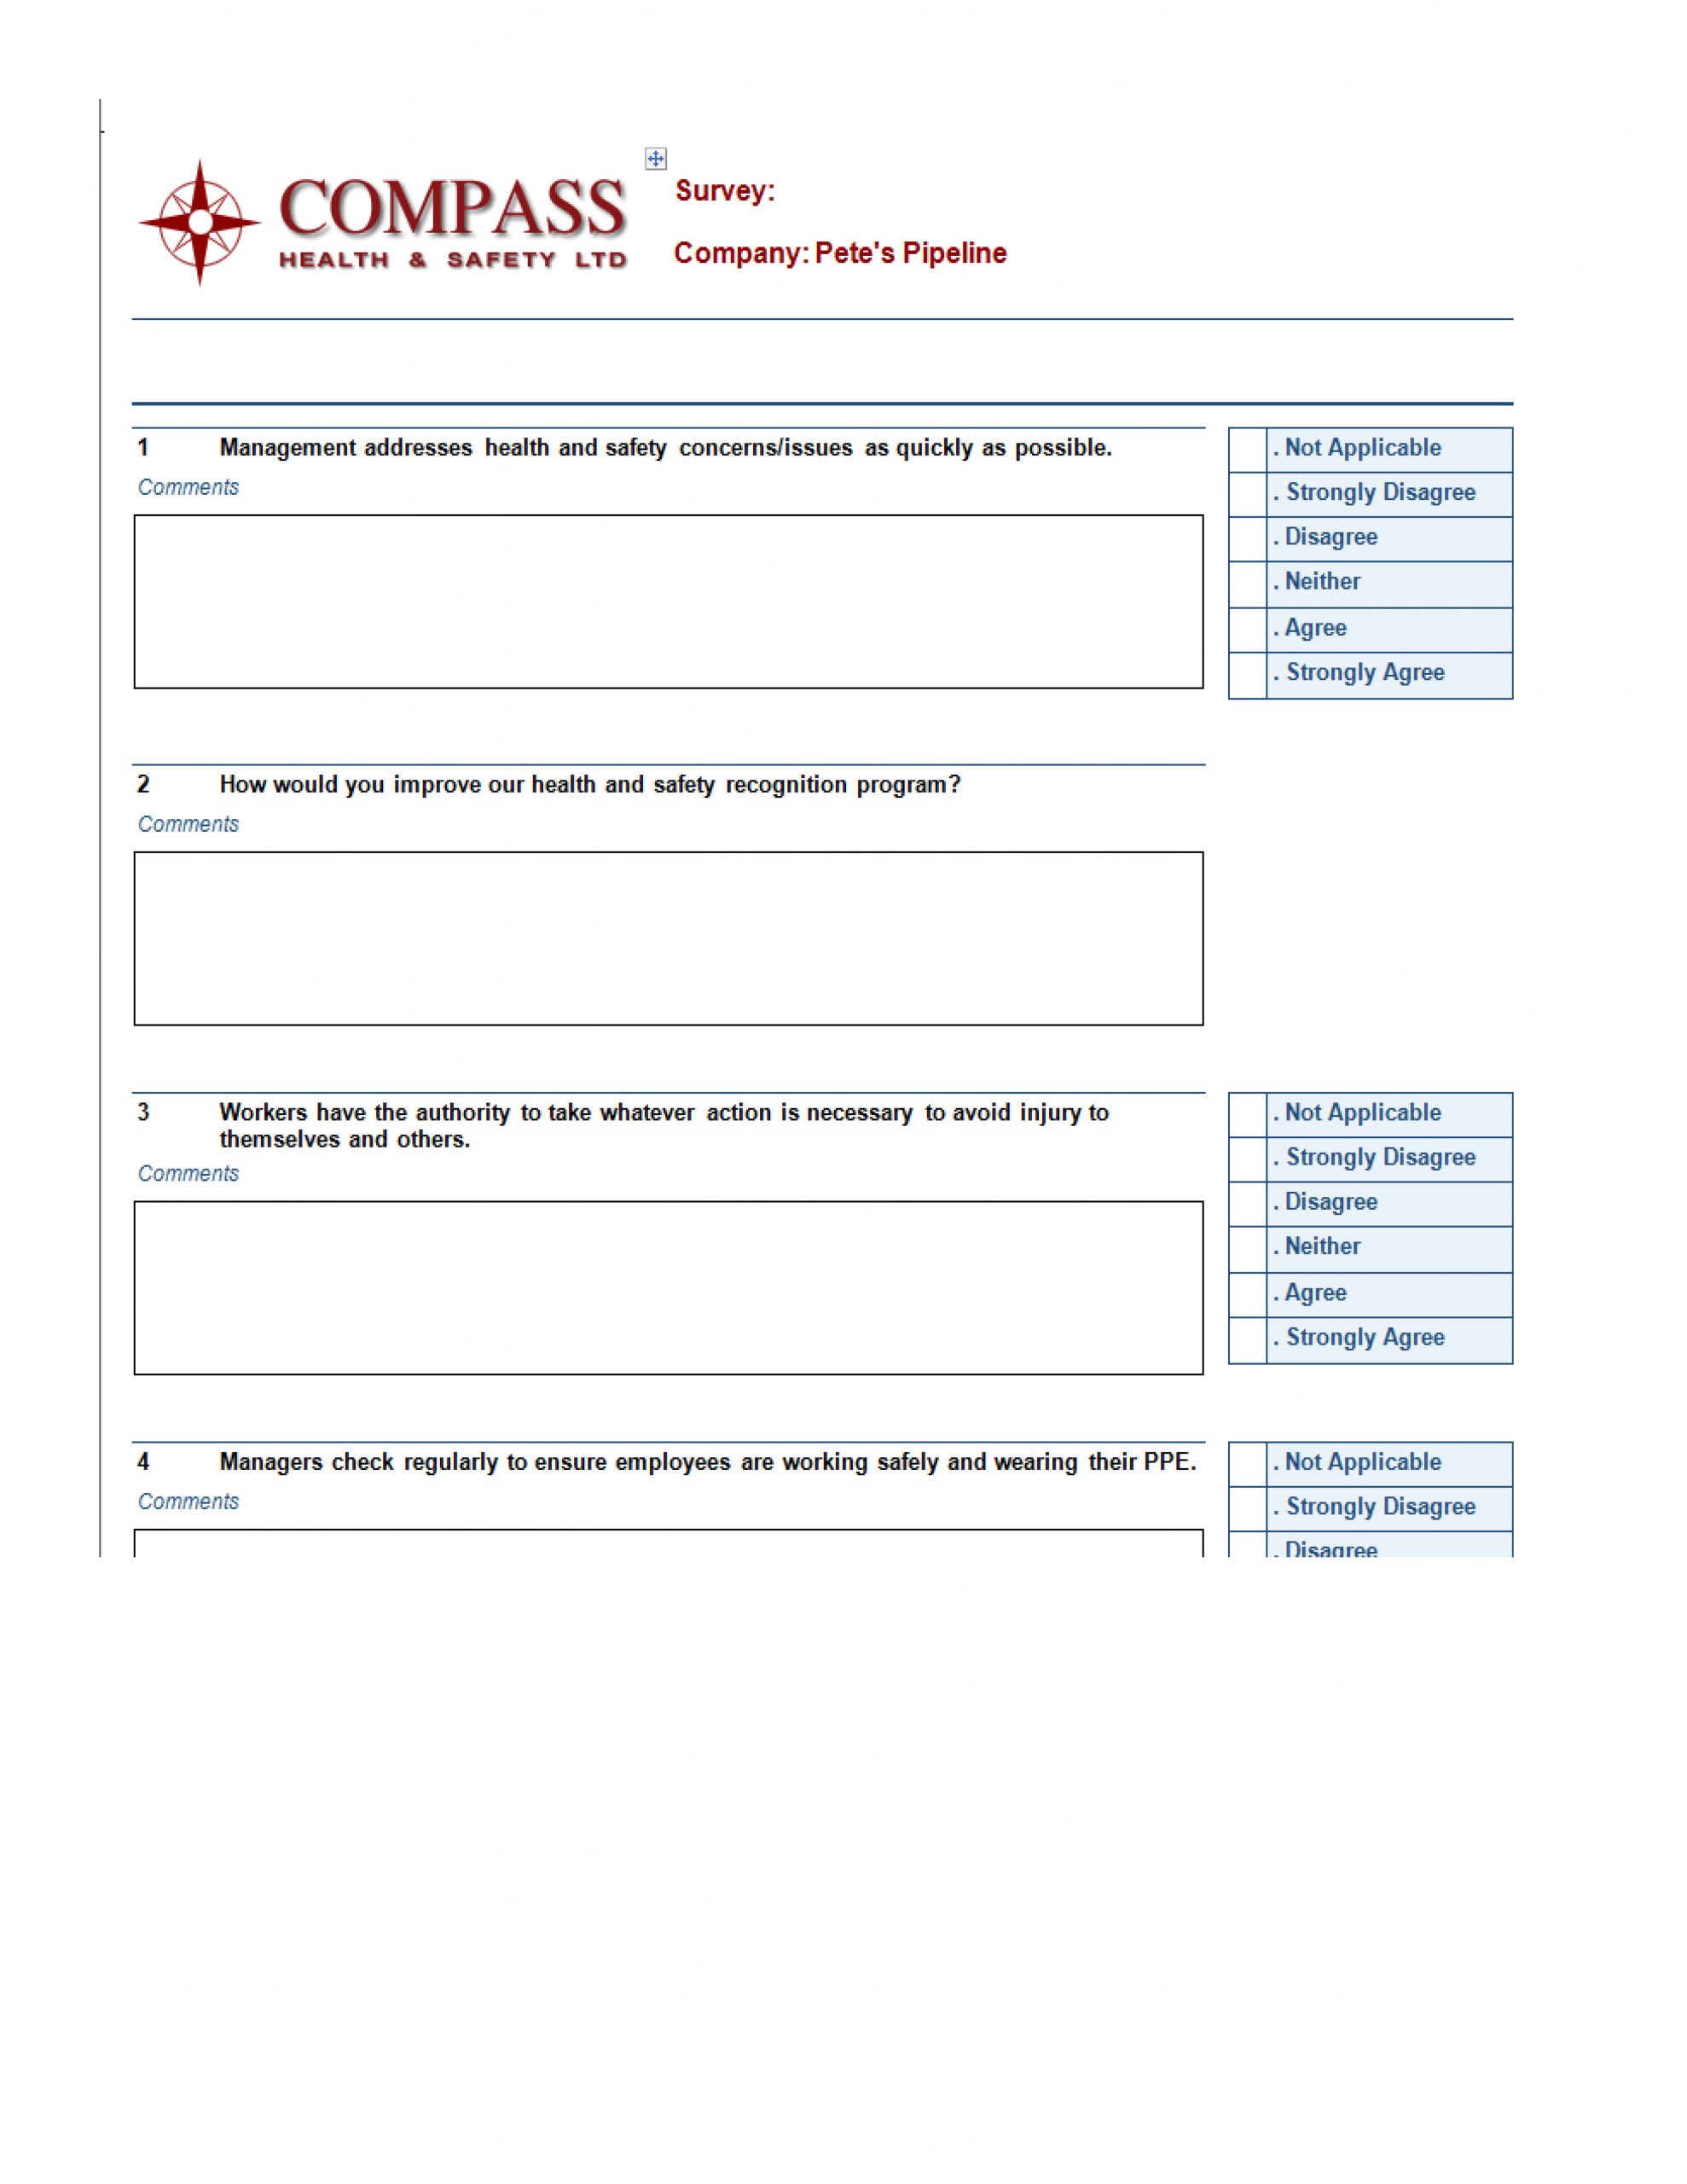
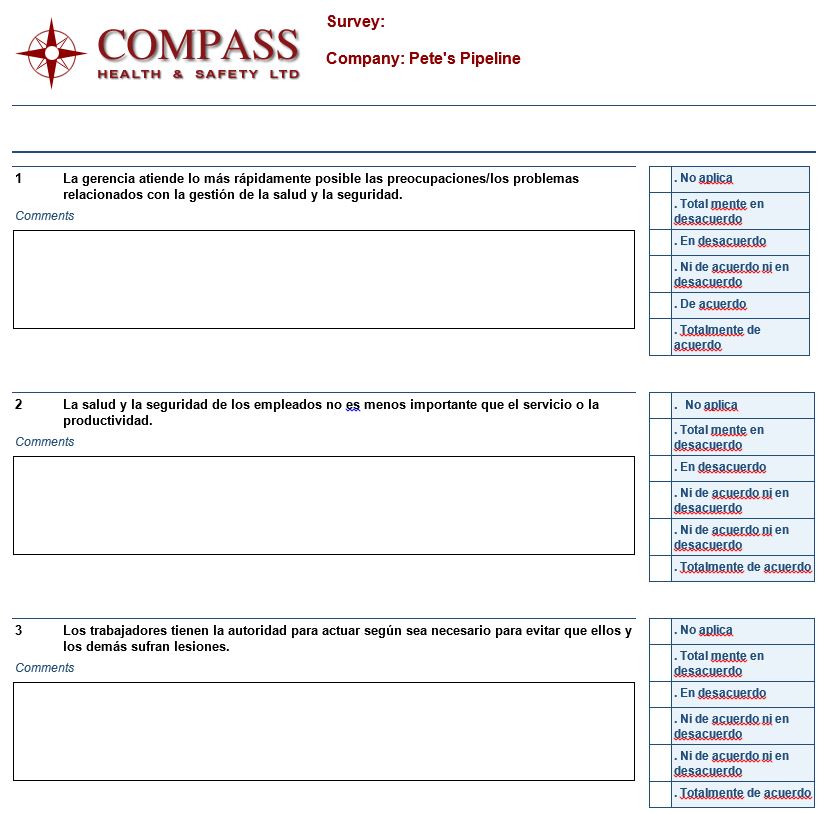
Sample Survey Questions
Our surveys always allow respondents to score the question but also explain why they scored as they did. Comments are invaluable in assessing the rationale for the scoring and in determining future direction.
Questions That do not Affect Scoring -Two Options
Our survey application allows users to include questions that they do not want quantified. This feature is particularly useful for companies working under a standard industry group/association survey but have survey needs that are not included in the standard survey. They also have the option to include the additional questions in their survey but toggle in or out the results of those specific questions. This allows them to continue to participate in the standard association survey as well as bench mark against peers.
Survey in 100 different Languages
Survey participants select their own language in which to view the survey questions.
Reporting Categories
When you select a question from the master question list, each question is saved into a health and safety category. You can select a report to display questions and findings by categories such as Management Involvement & Commitment, Communication, etc.
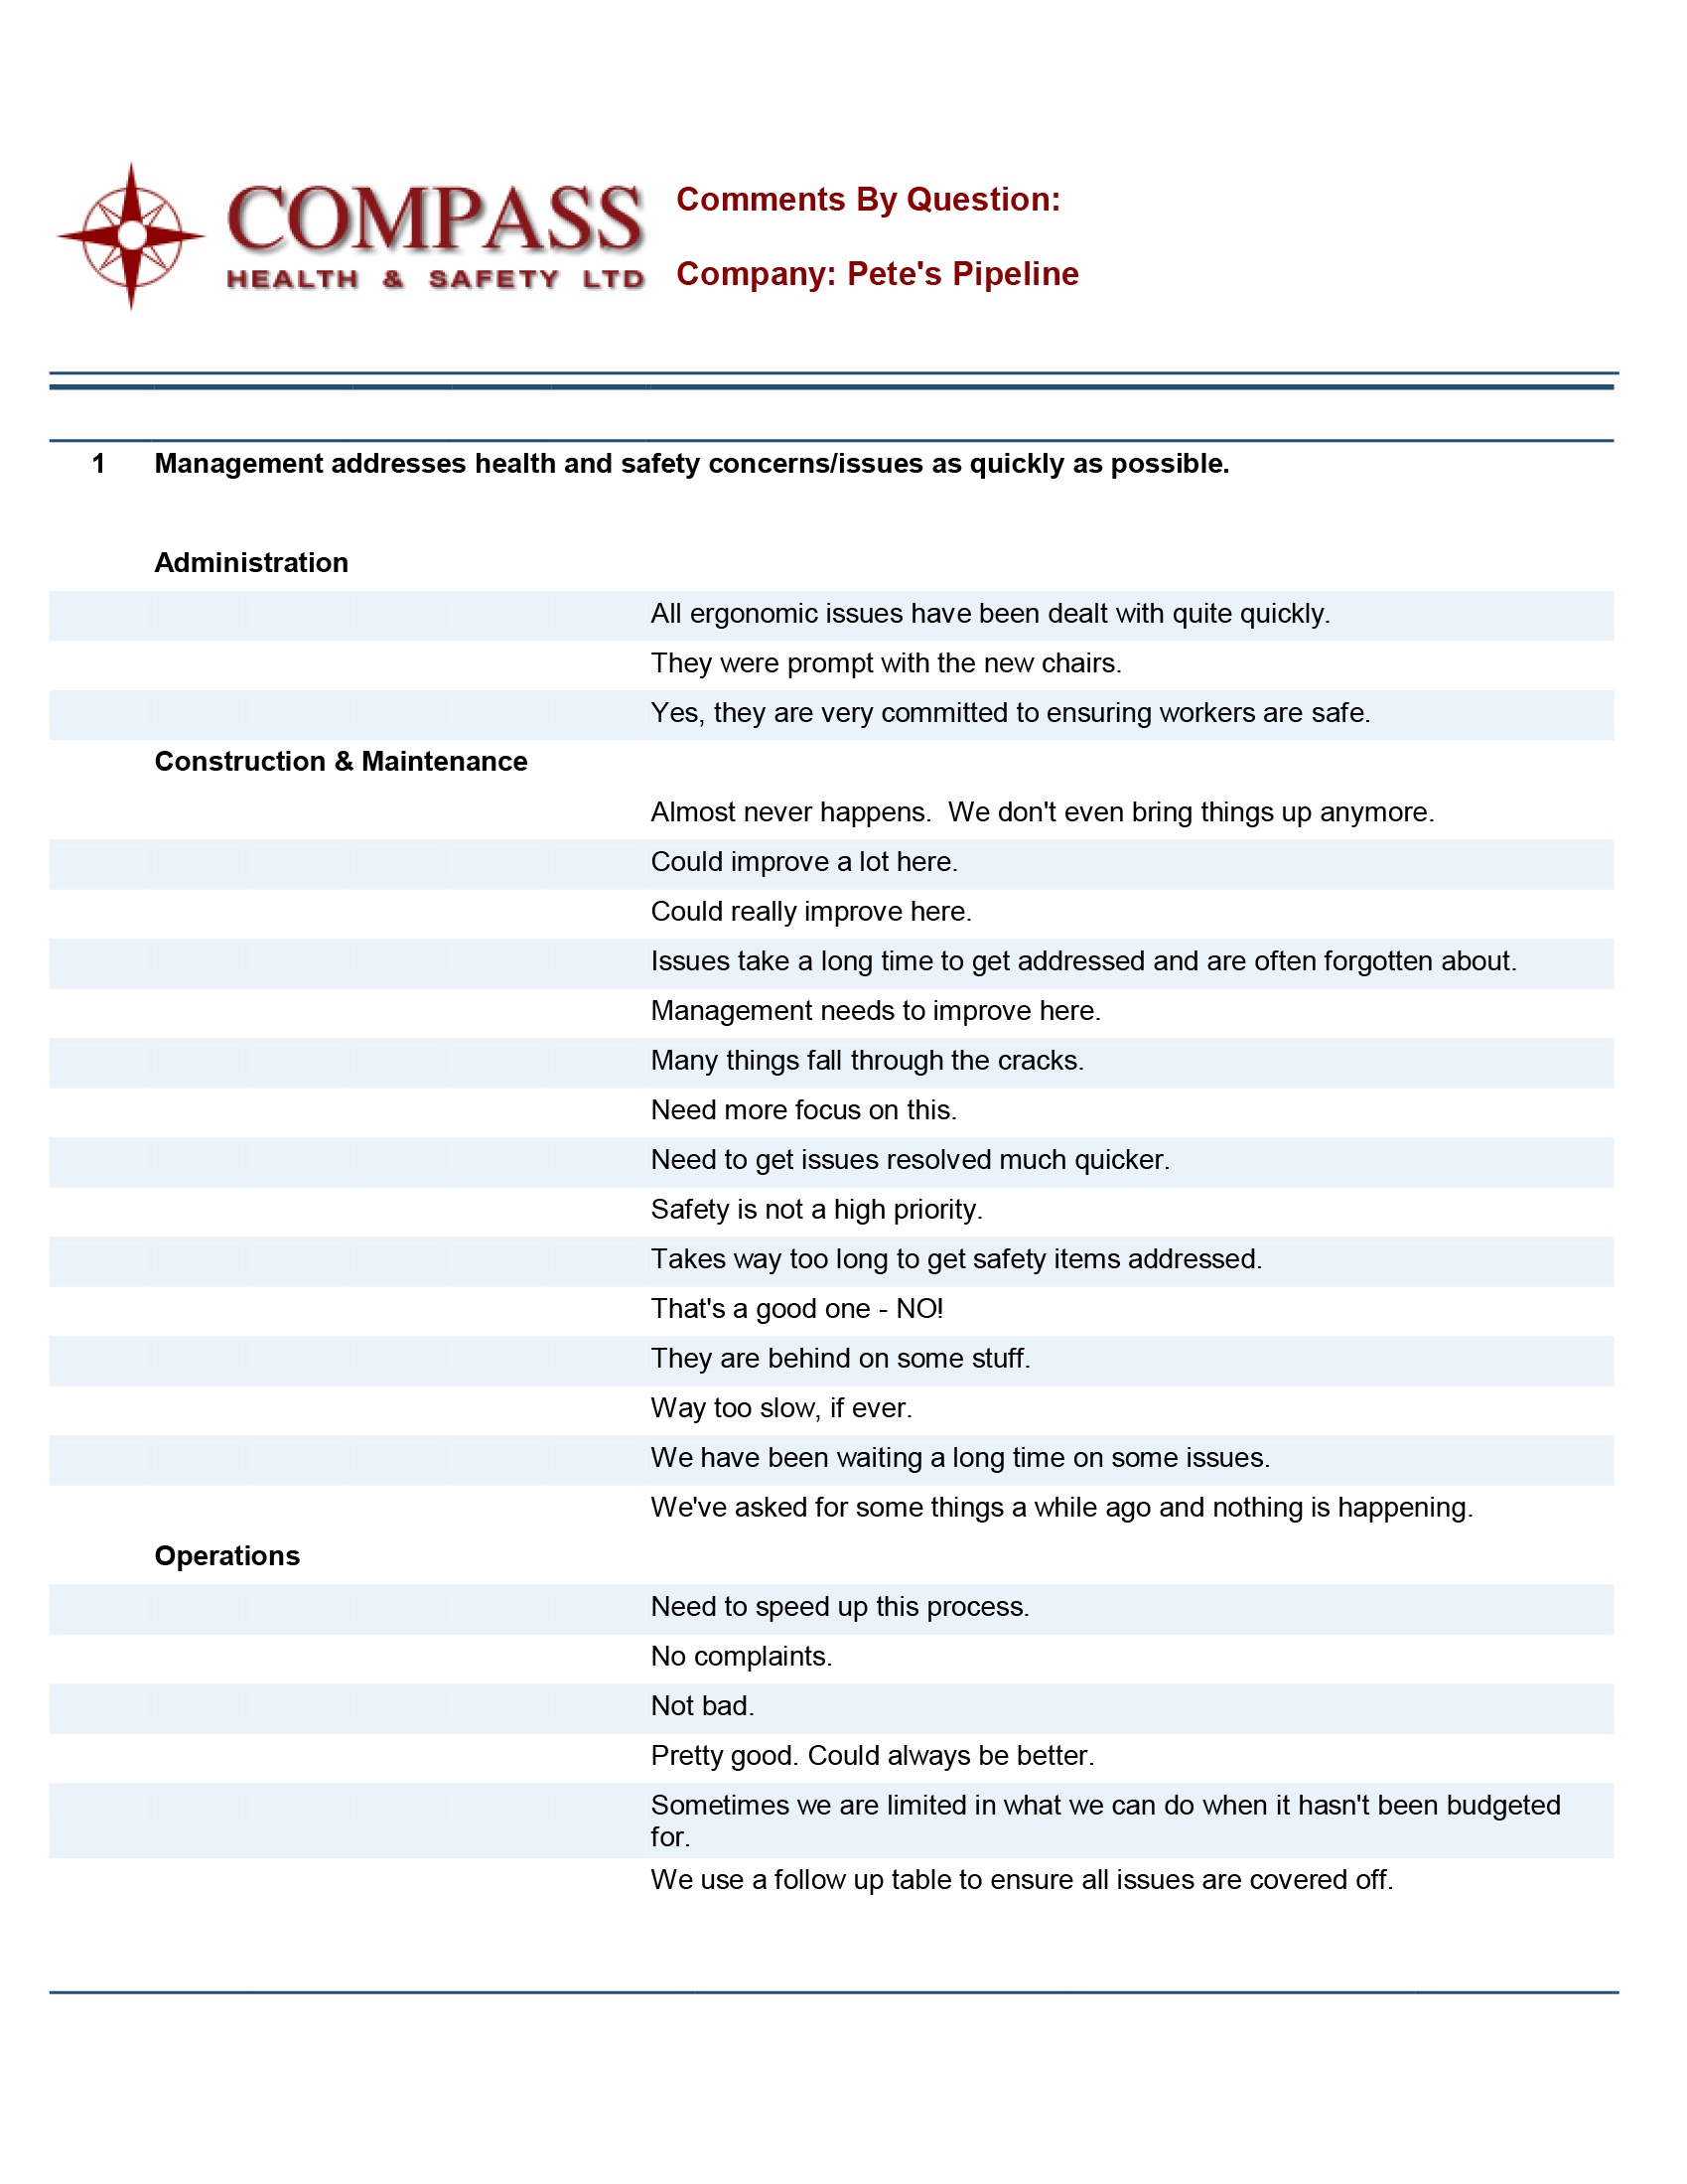
Comments By Question
Compass surveys encourages employees to comment on every question. These comments help validate the scores and provide direction for future action. Survey that do not allow for respondent comments provide only scores to questions but offer little direction on why the respondent scored as they did. This results in a great deal of work following administration of the survey to determine the actions needed to improve.
Comments can be reported out by the reporting parameters you pick when you set up your survey. For example; if position, job and age are three survey parameters, you may select to report out by one, two or any number of parameters.
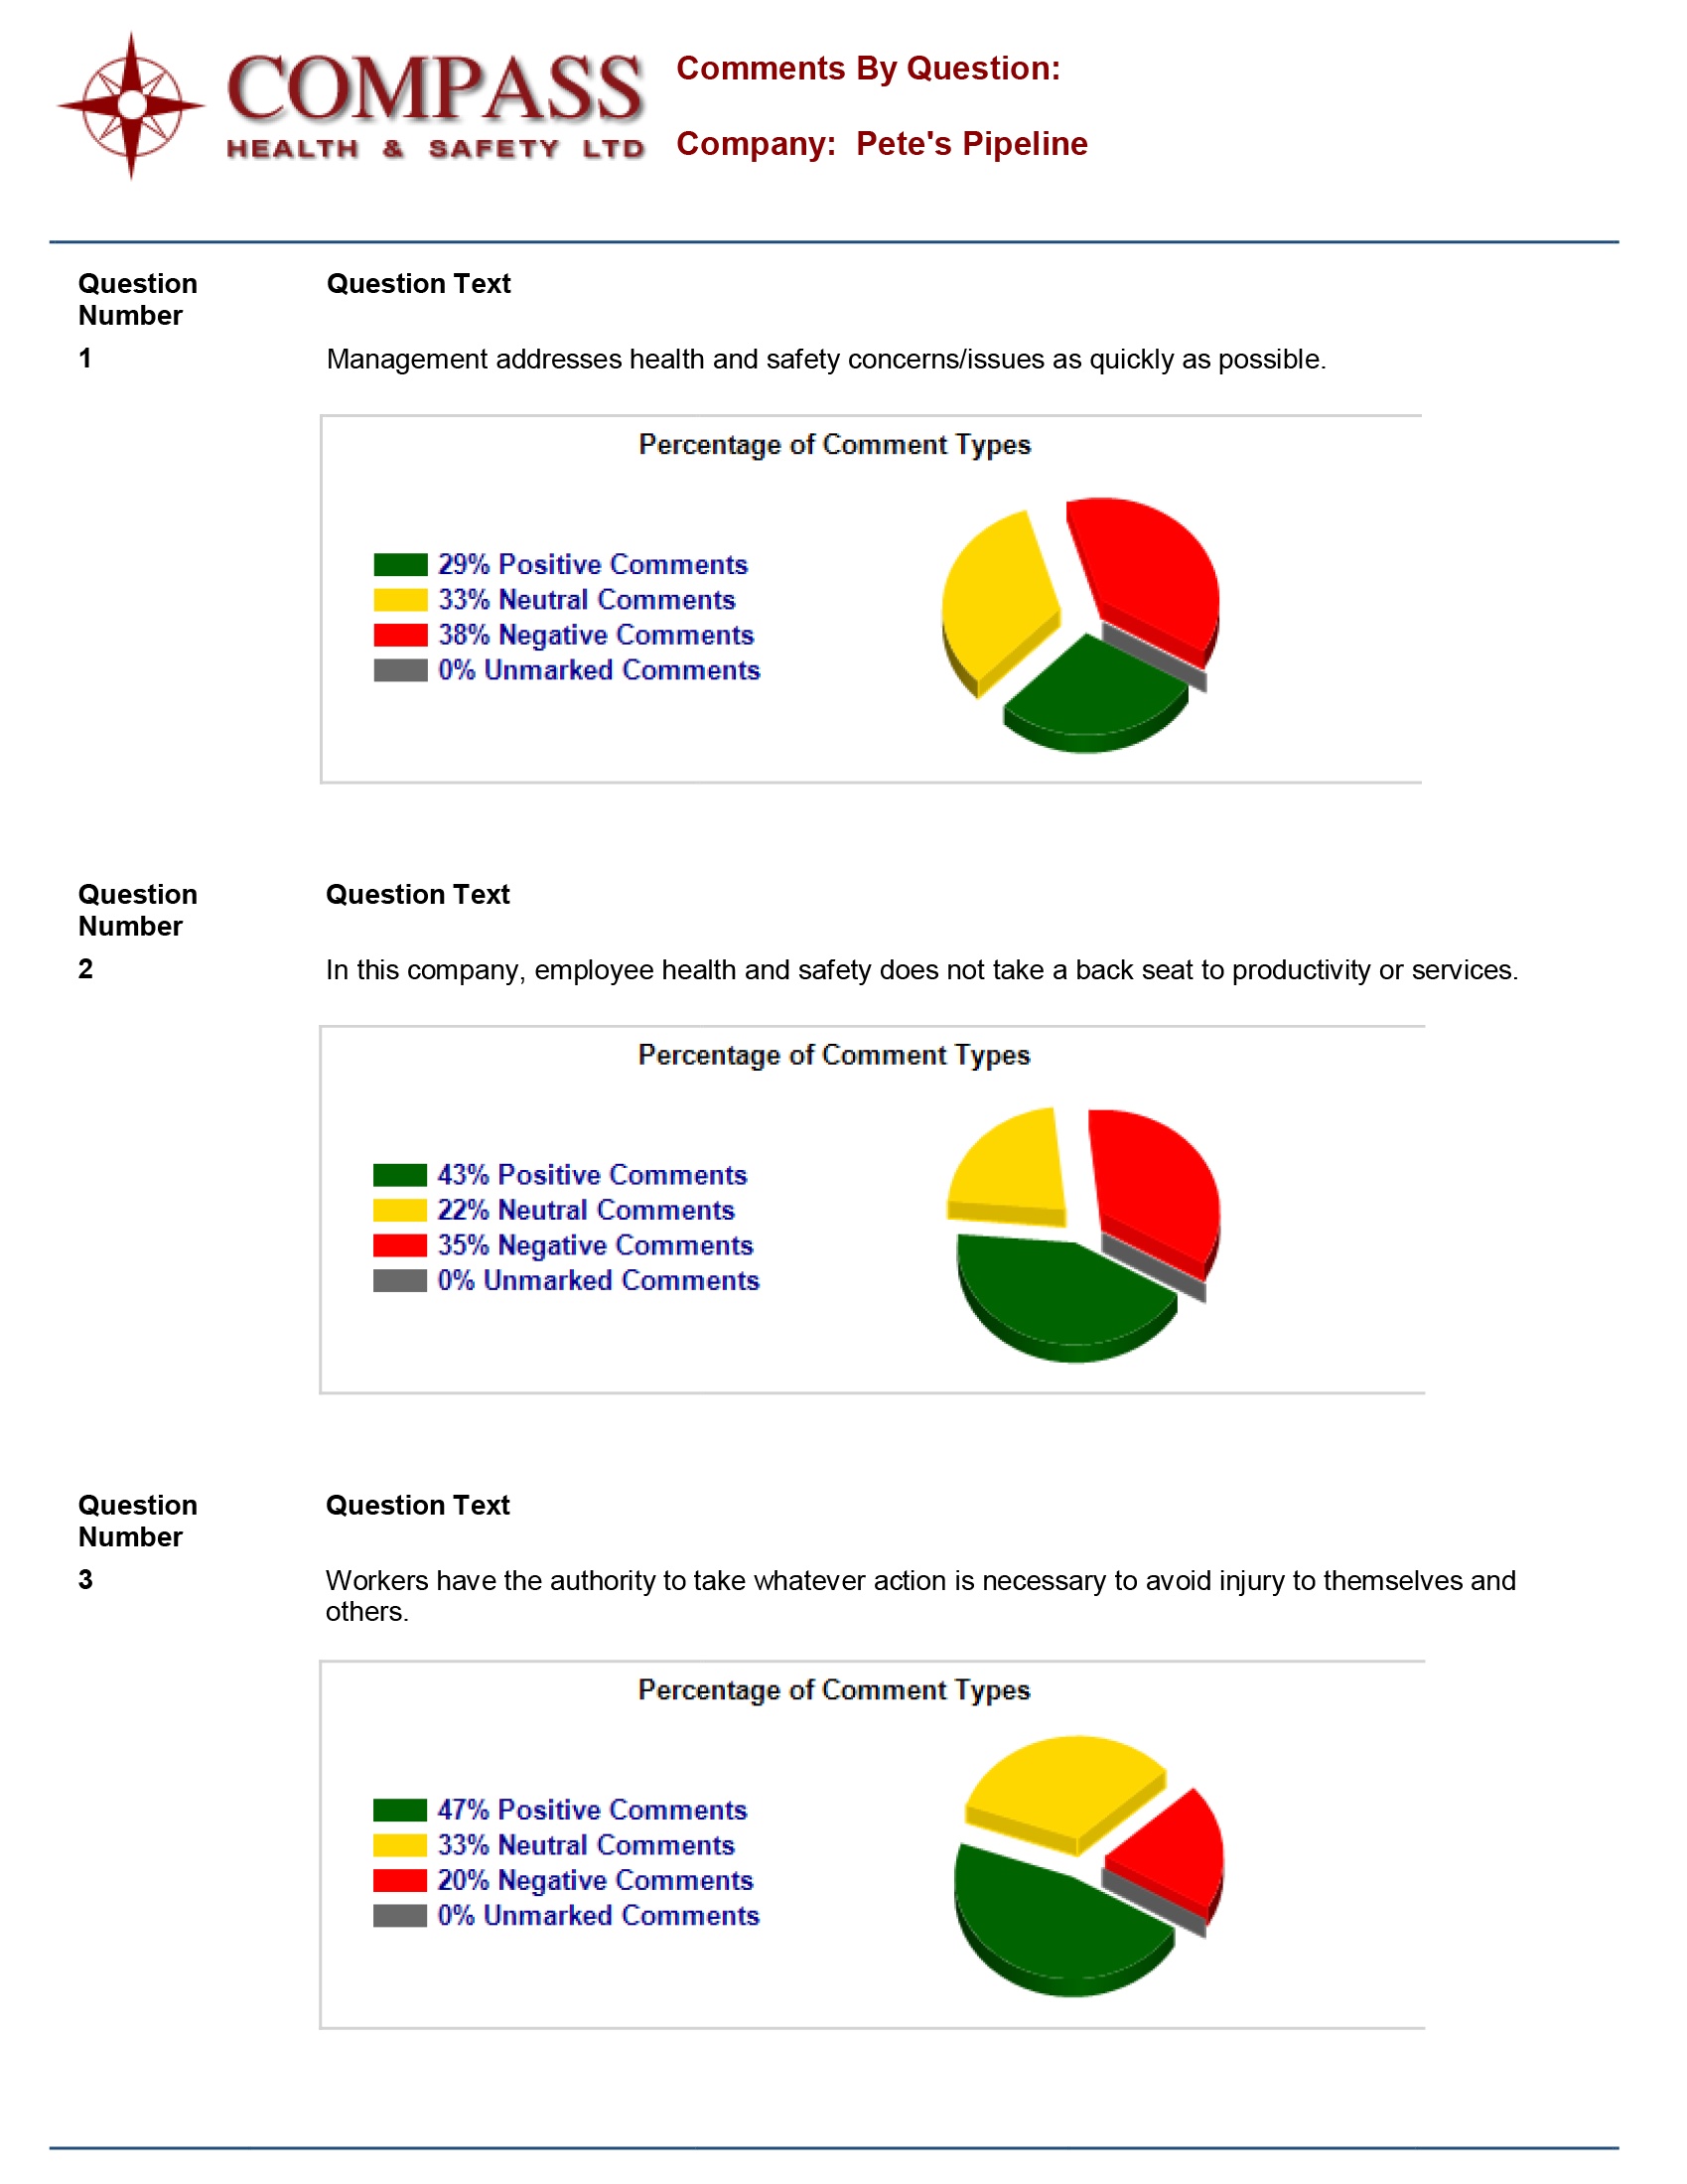
Comments Analysis
Comments for each question can be analyzed to be positive, negative or neutral. In order to use this report the user needs to mark each comment as positive, negative or neutral. Once marked, the data base will provide the report as shown below.
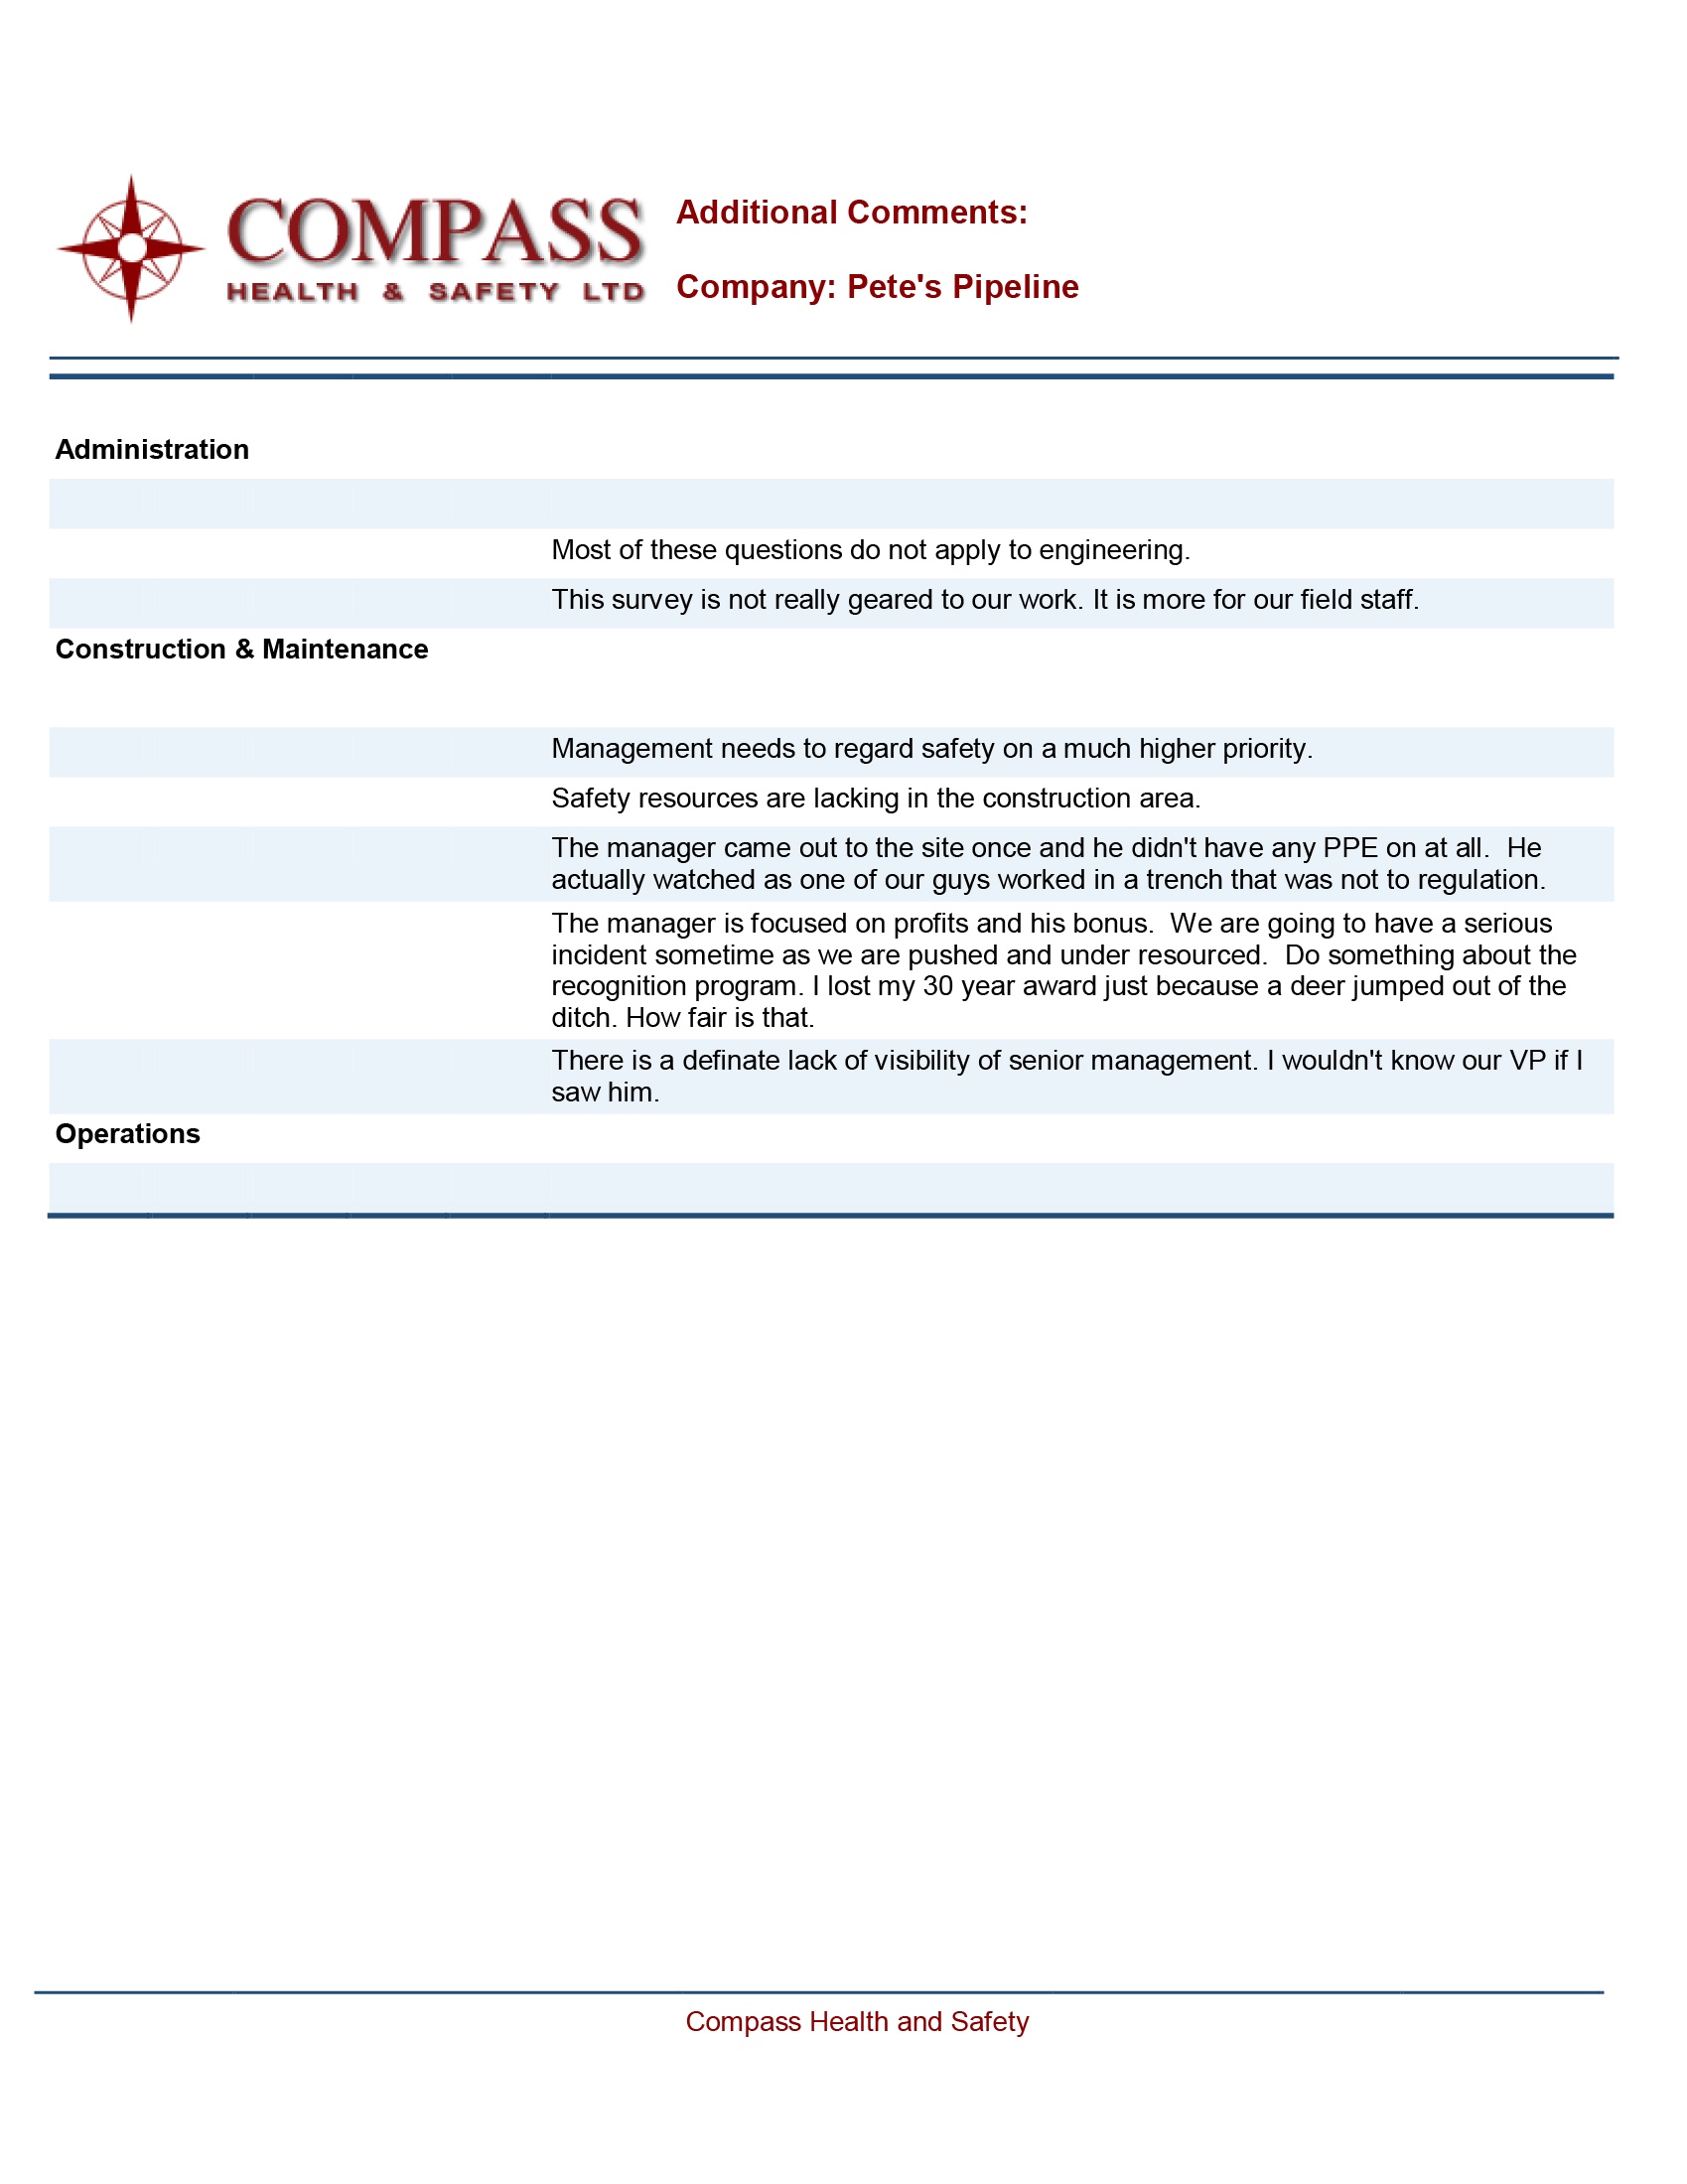
Additional Comments
Some clients like to ask for addition comments at the end of the survey or perhaps ask one final improvement question such as; “Is there anything we need to do better?” Our survey application will provide you with all additional comments by any survey reporting parameter you select.
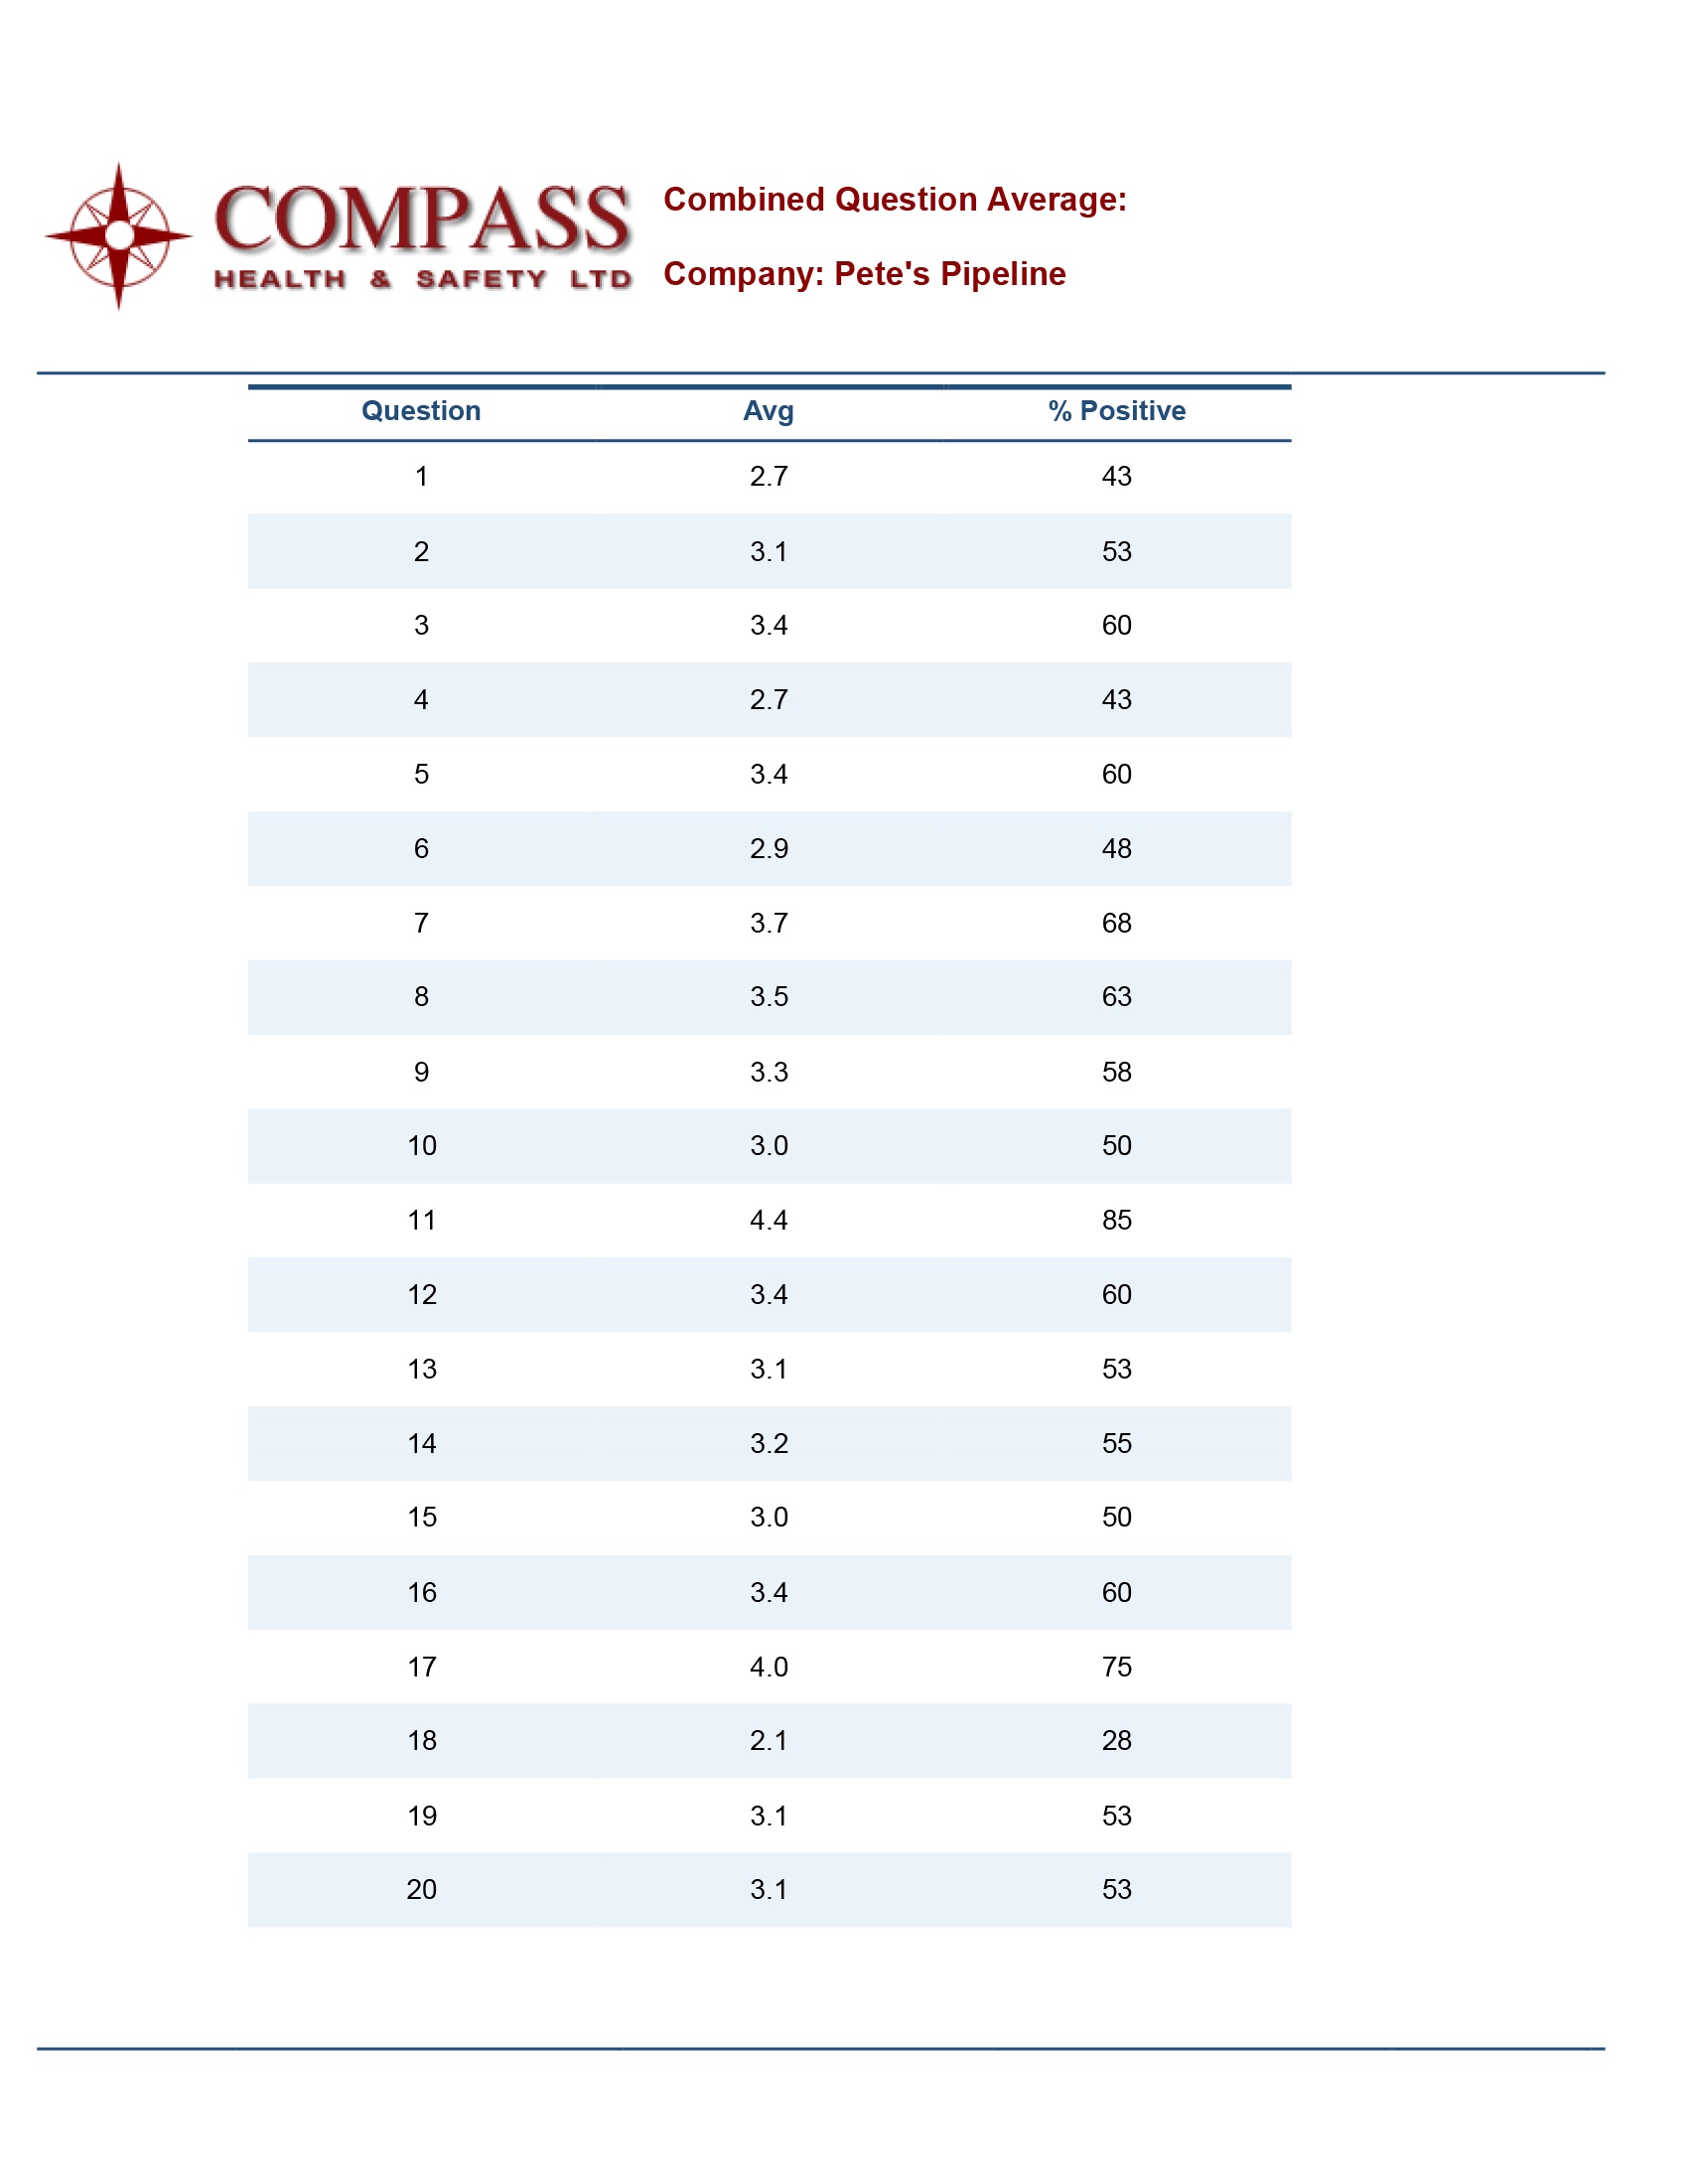
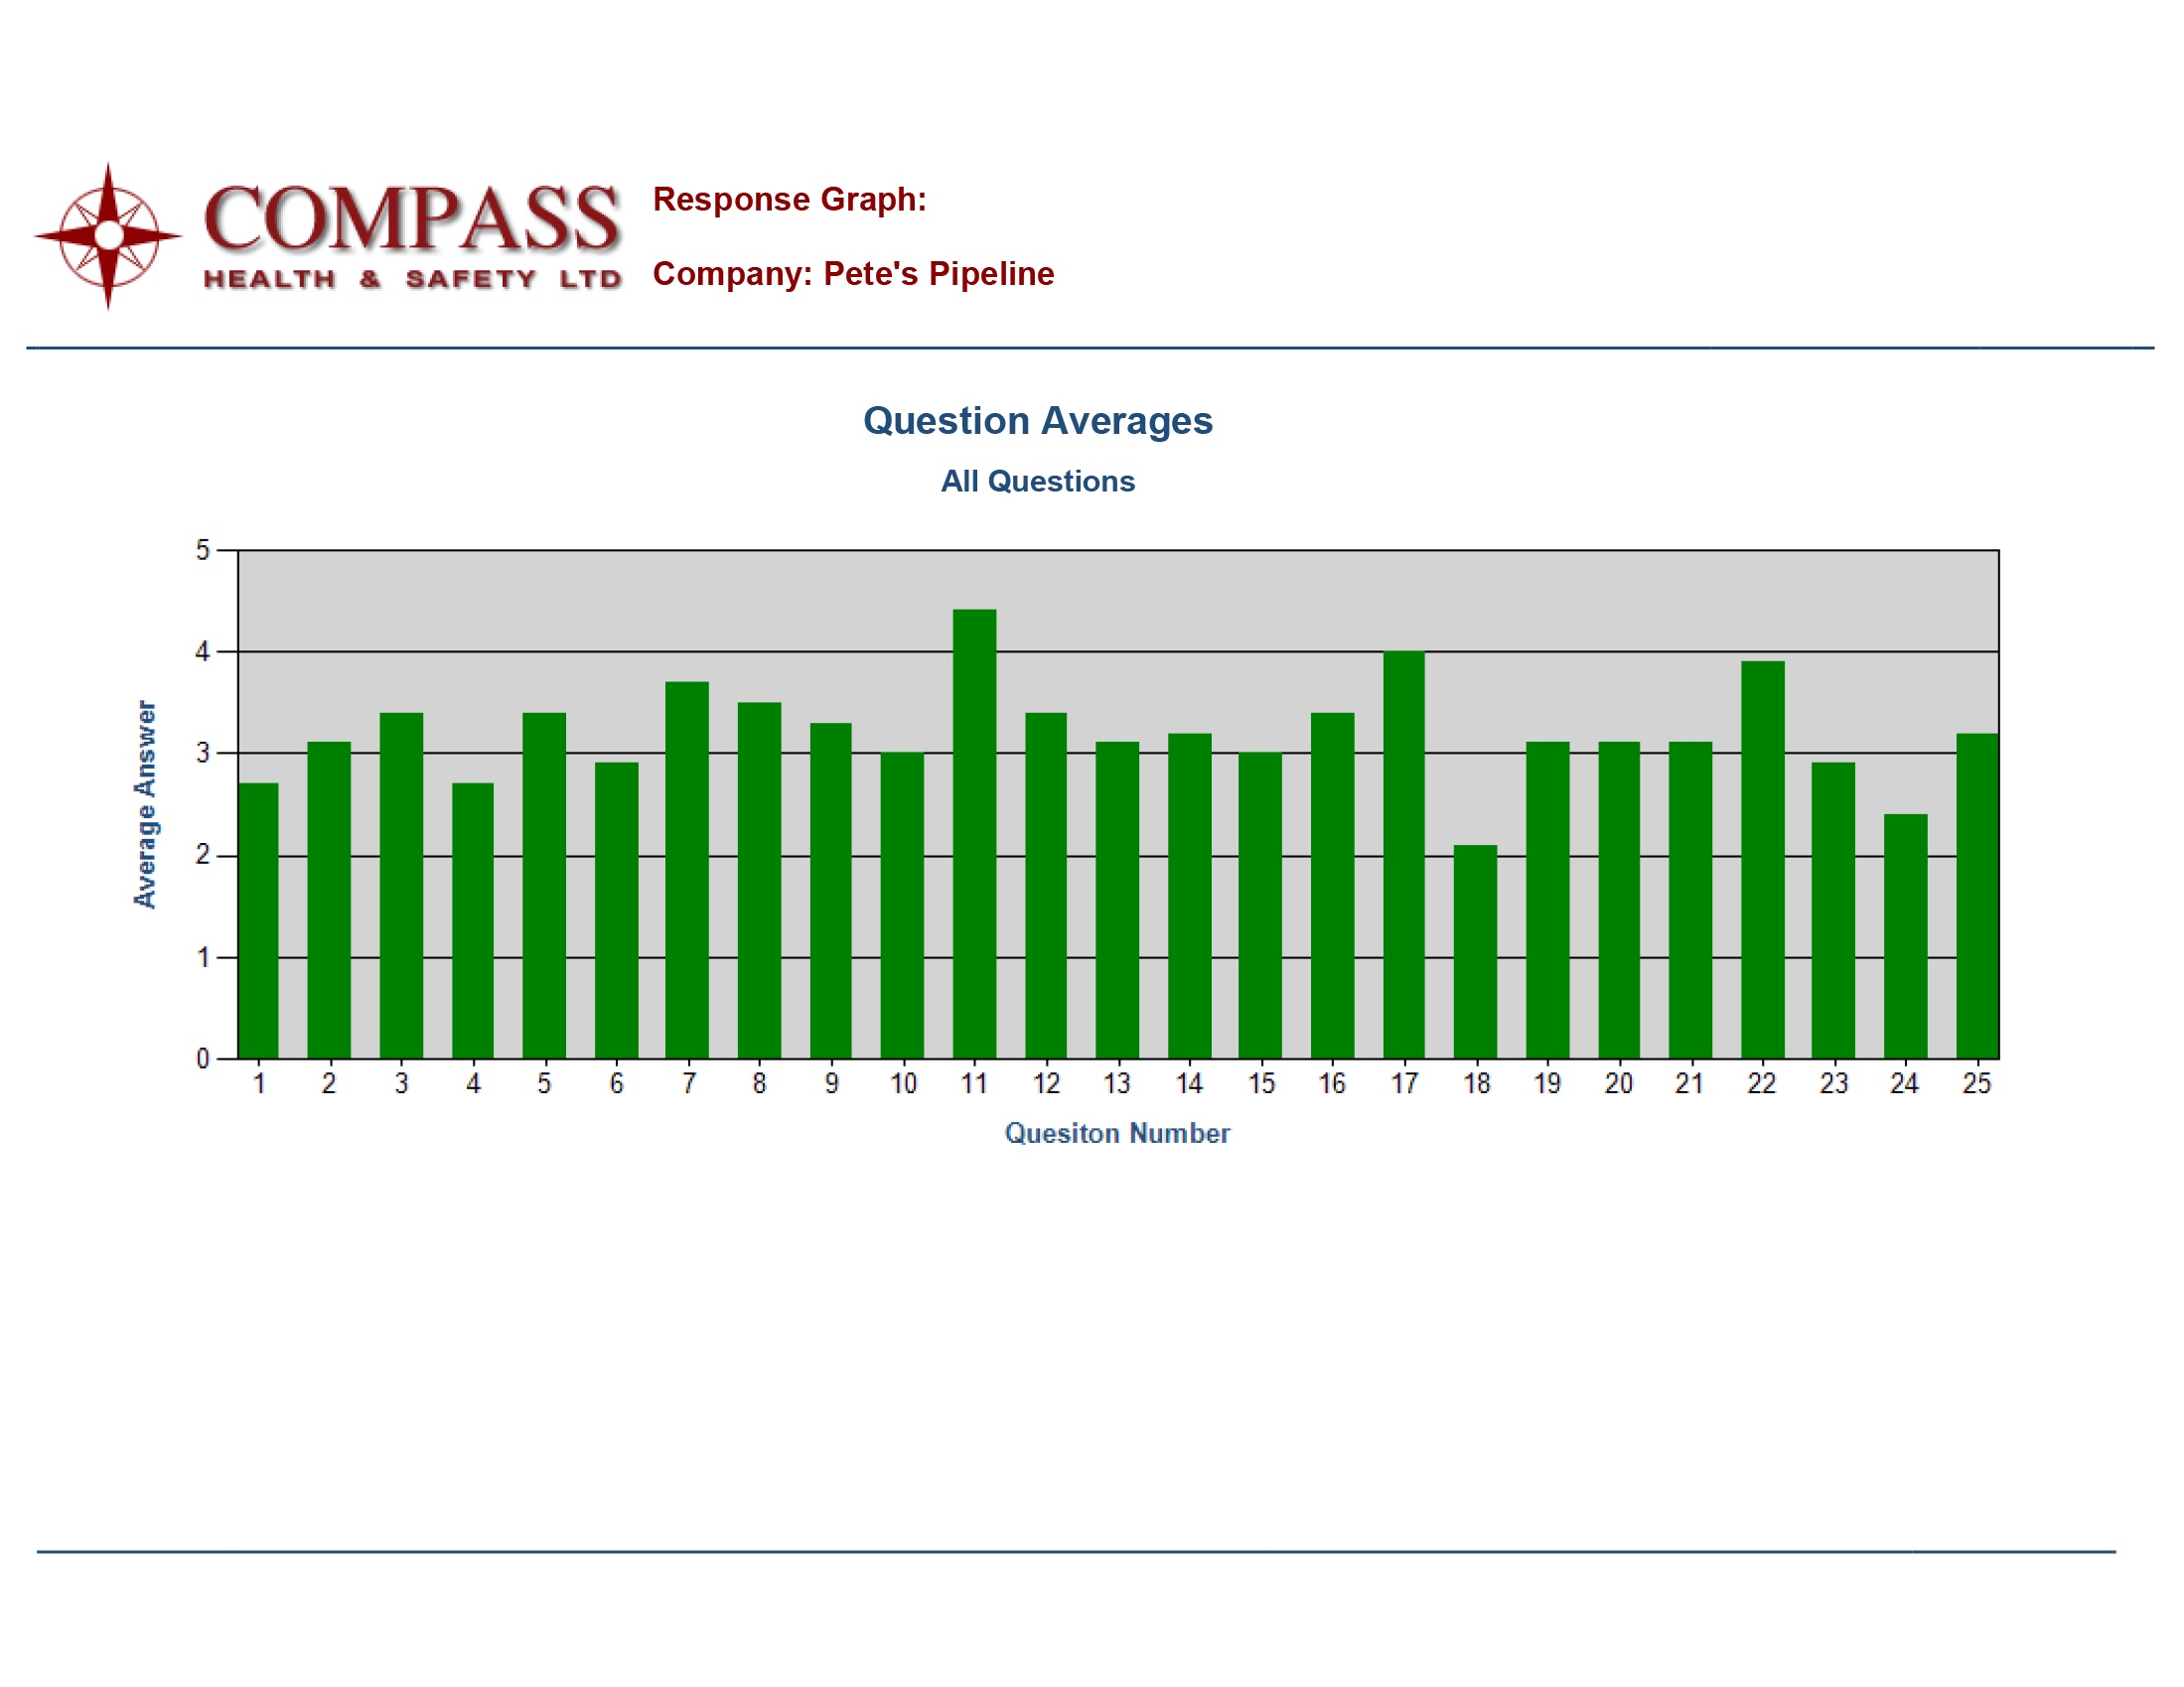
Question Average
This report shows the overall average to each question in the survey.
Hi-Low Question Average
This report ranks the questions in the survey from highest to lowest score

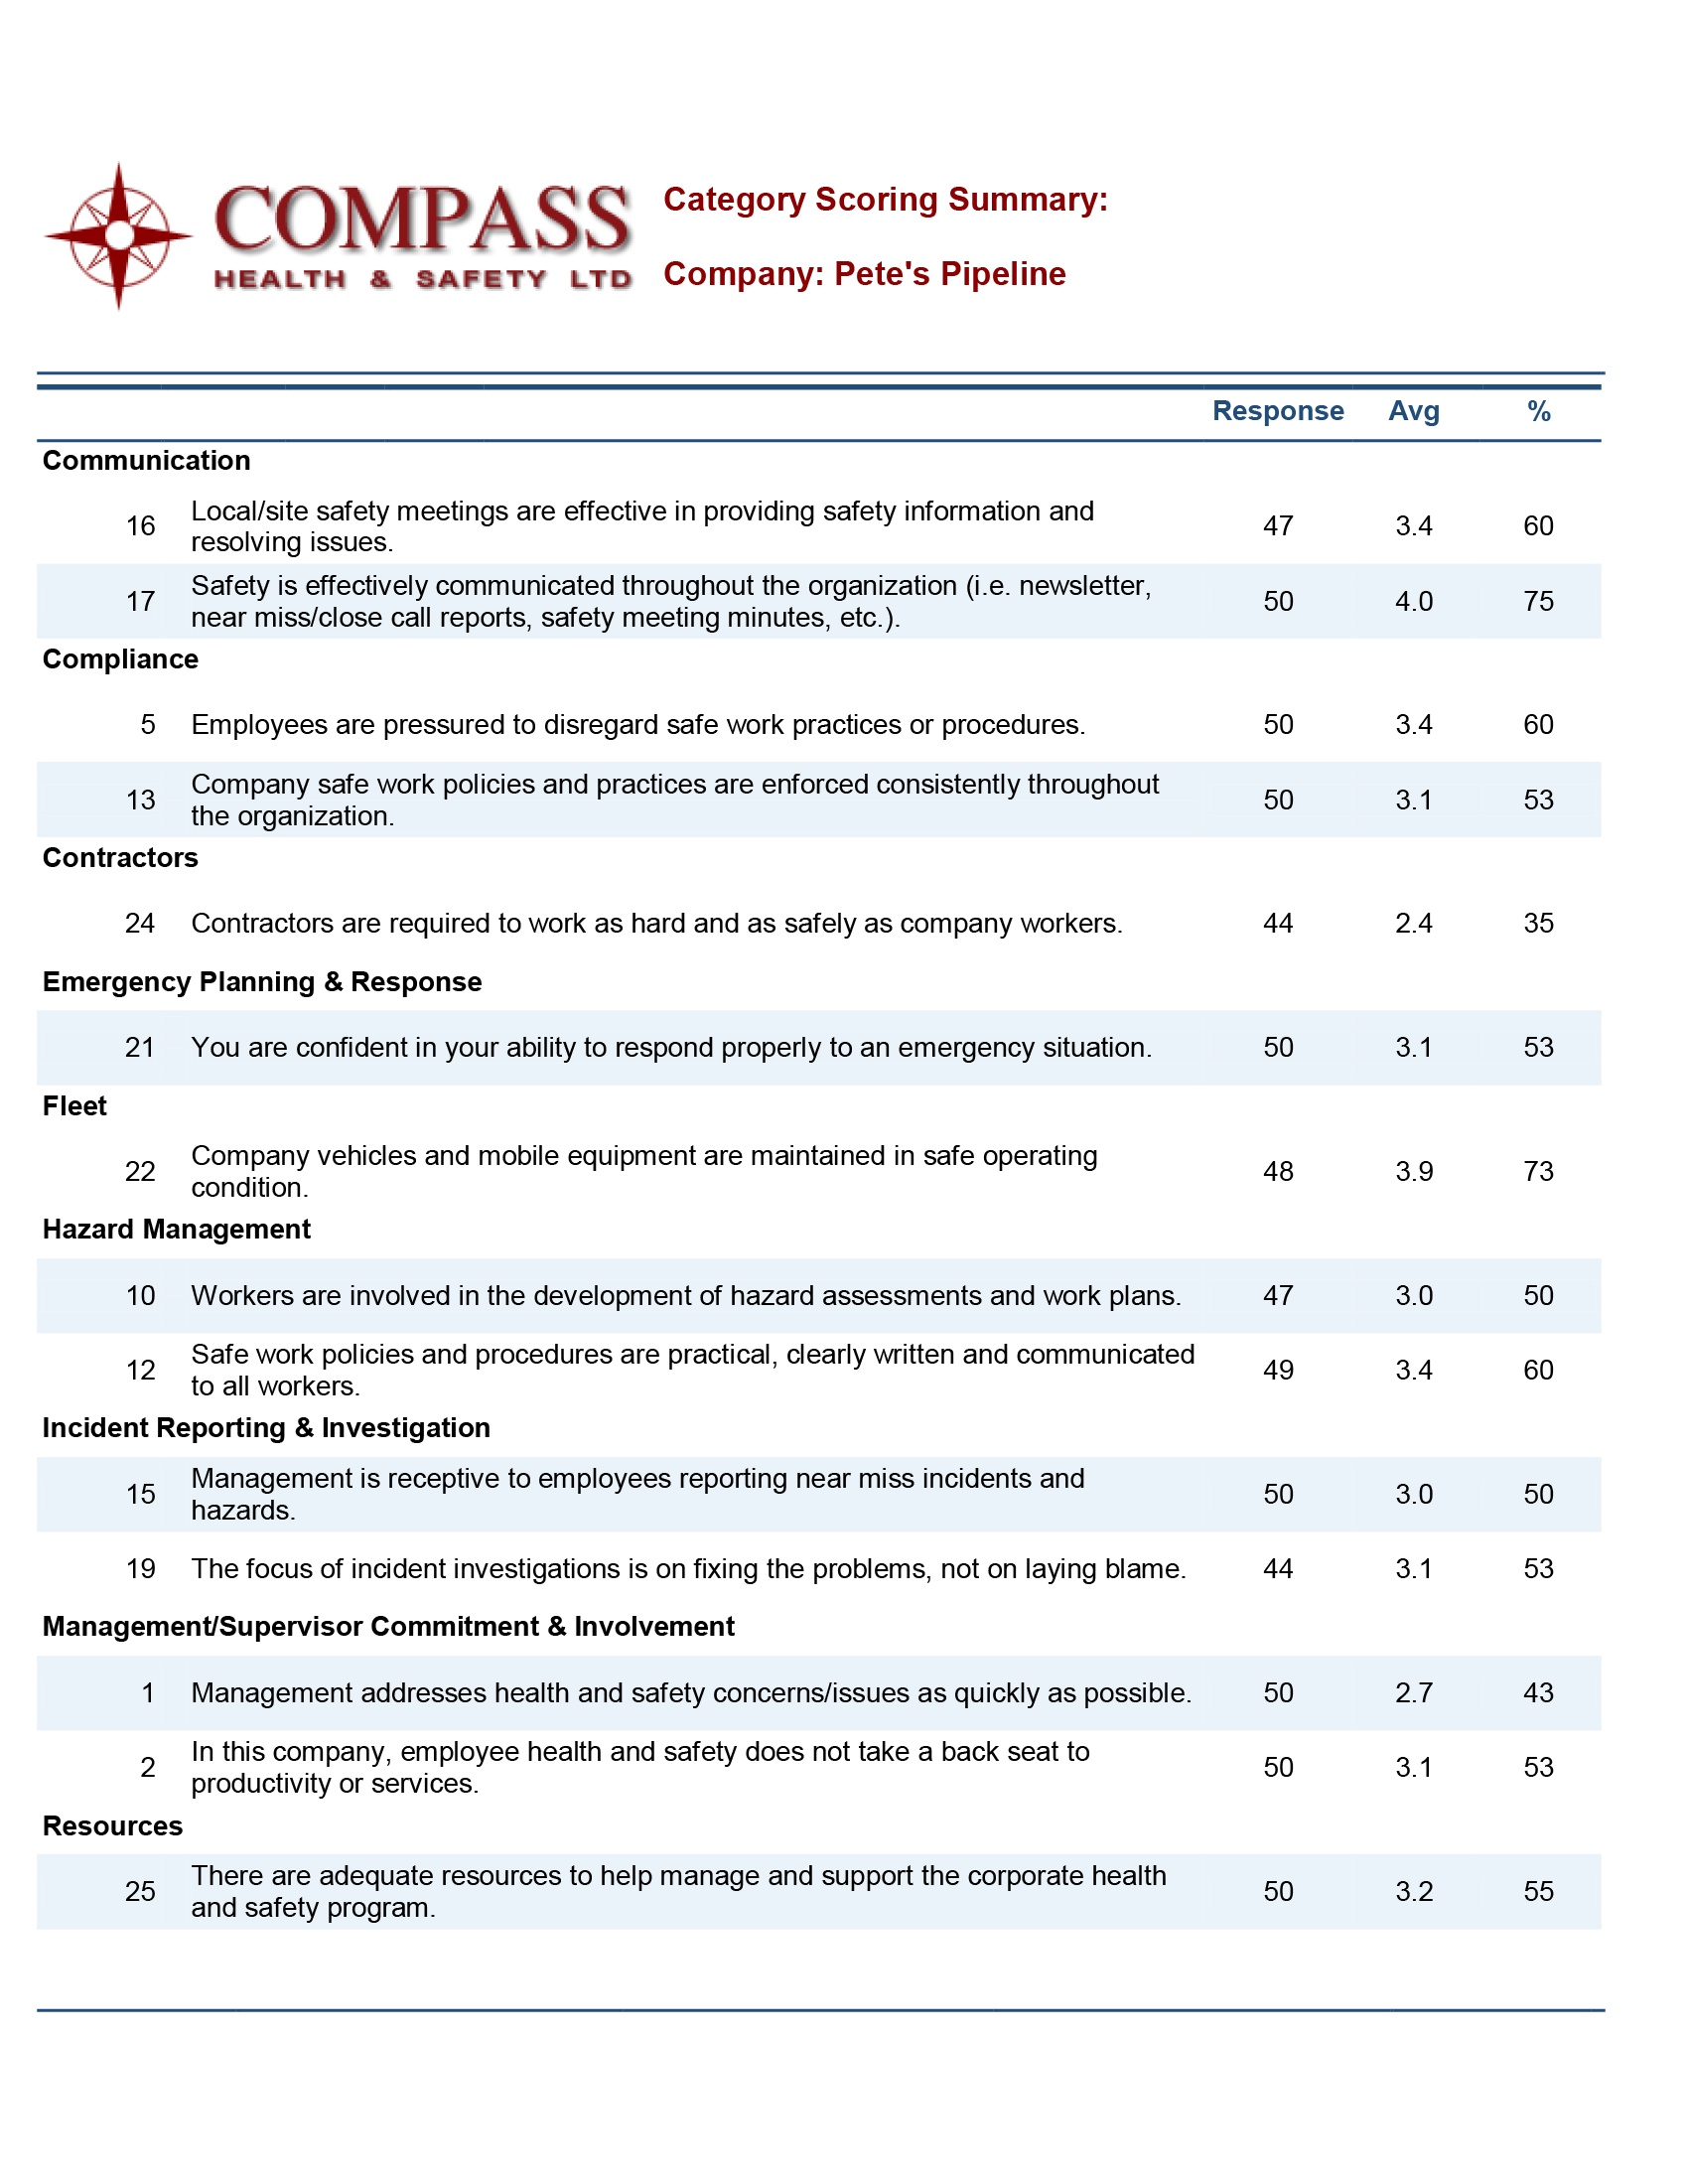
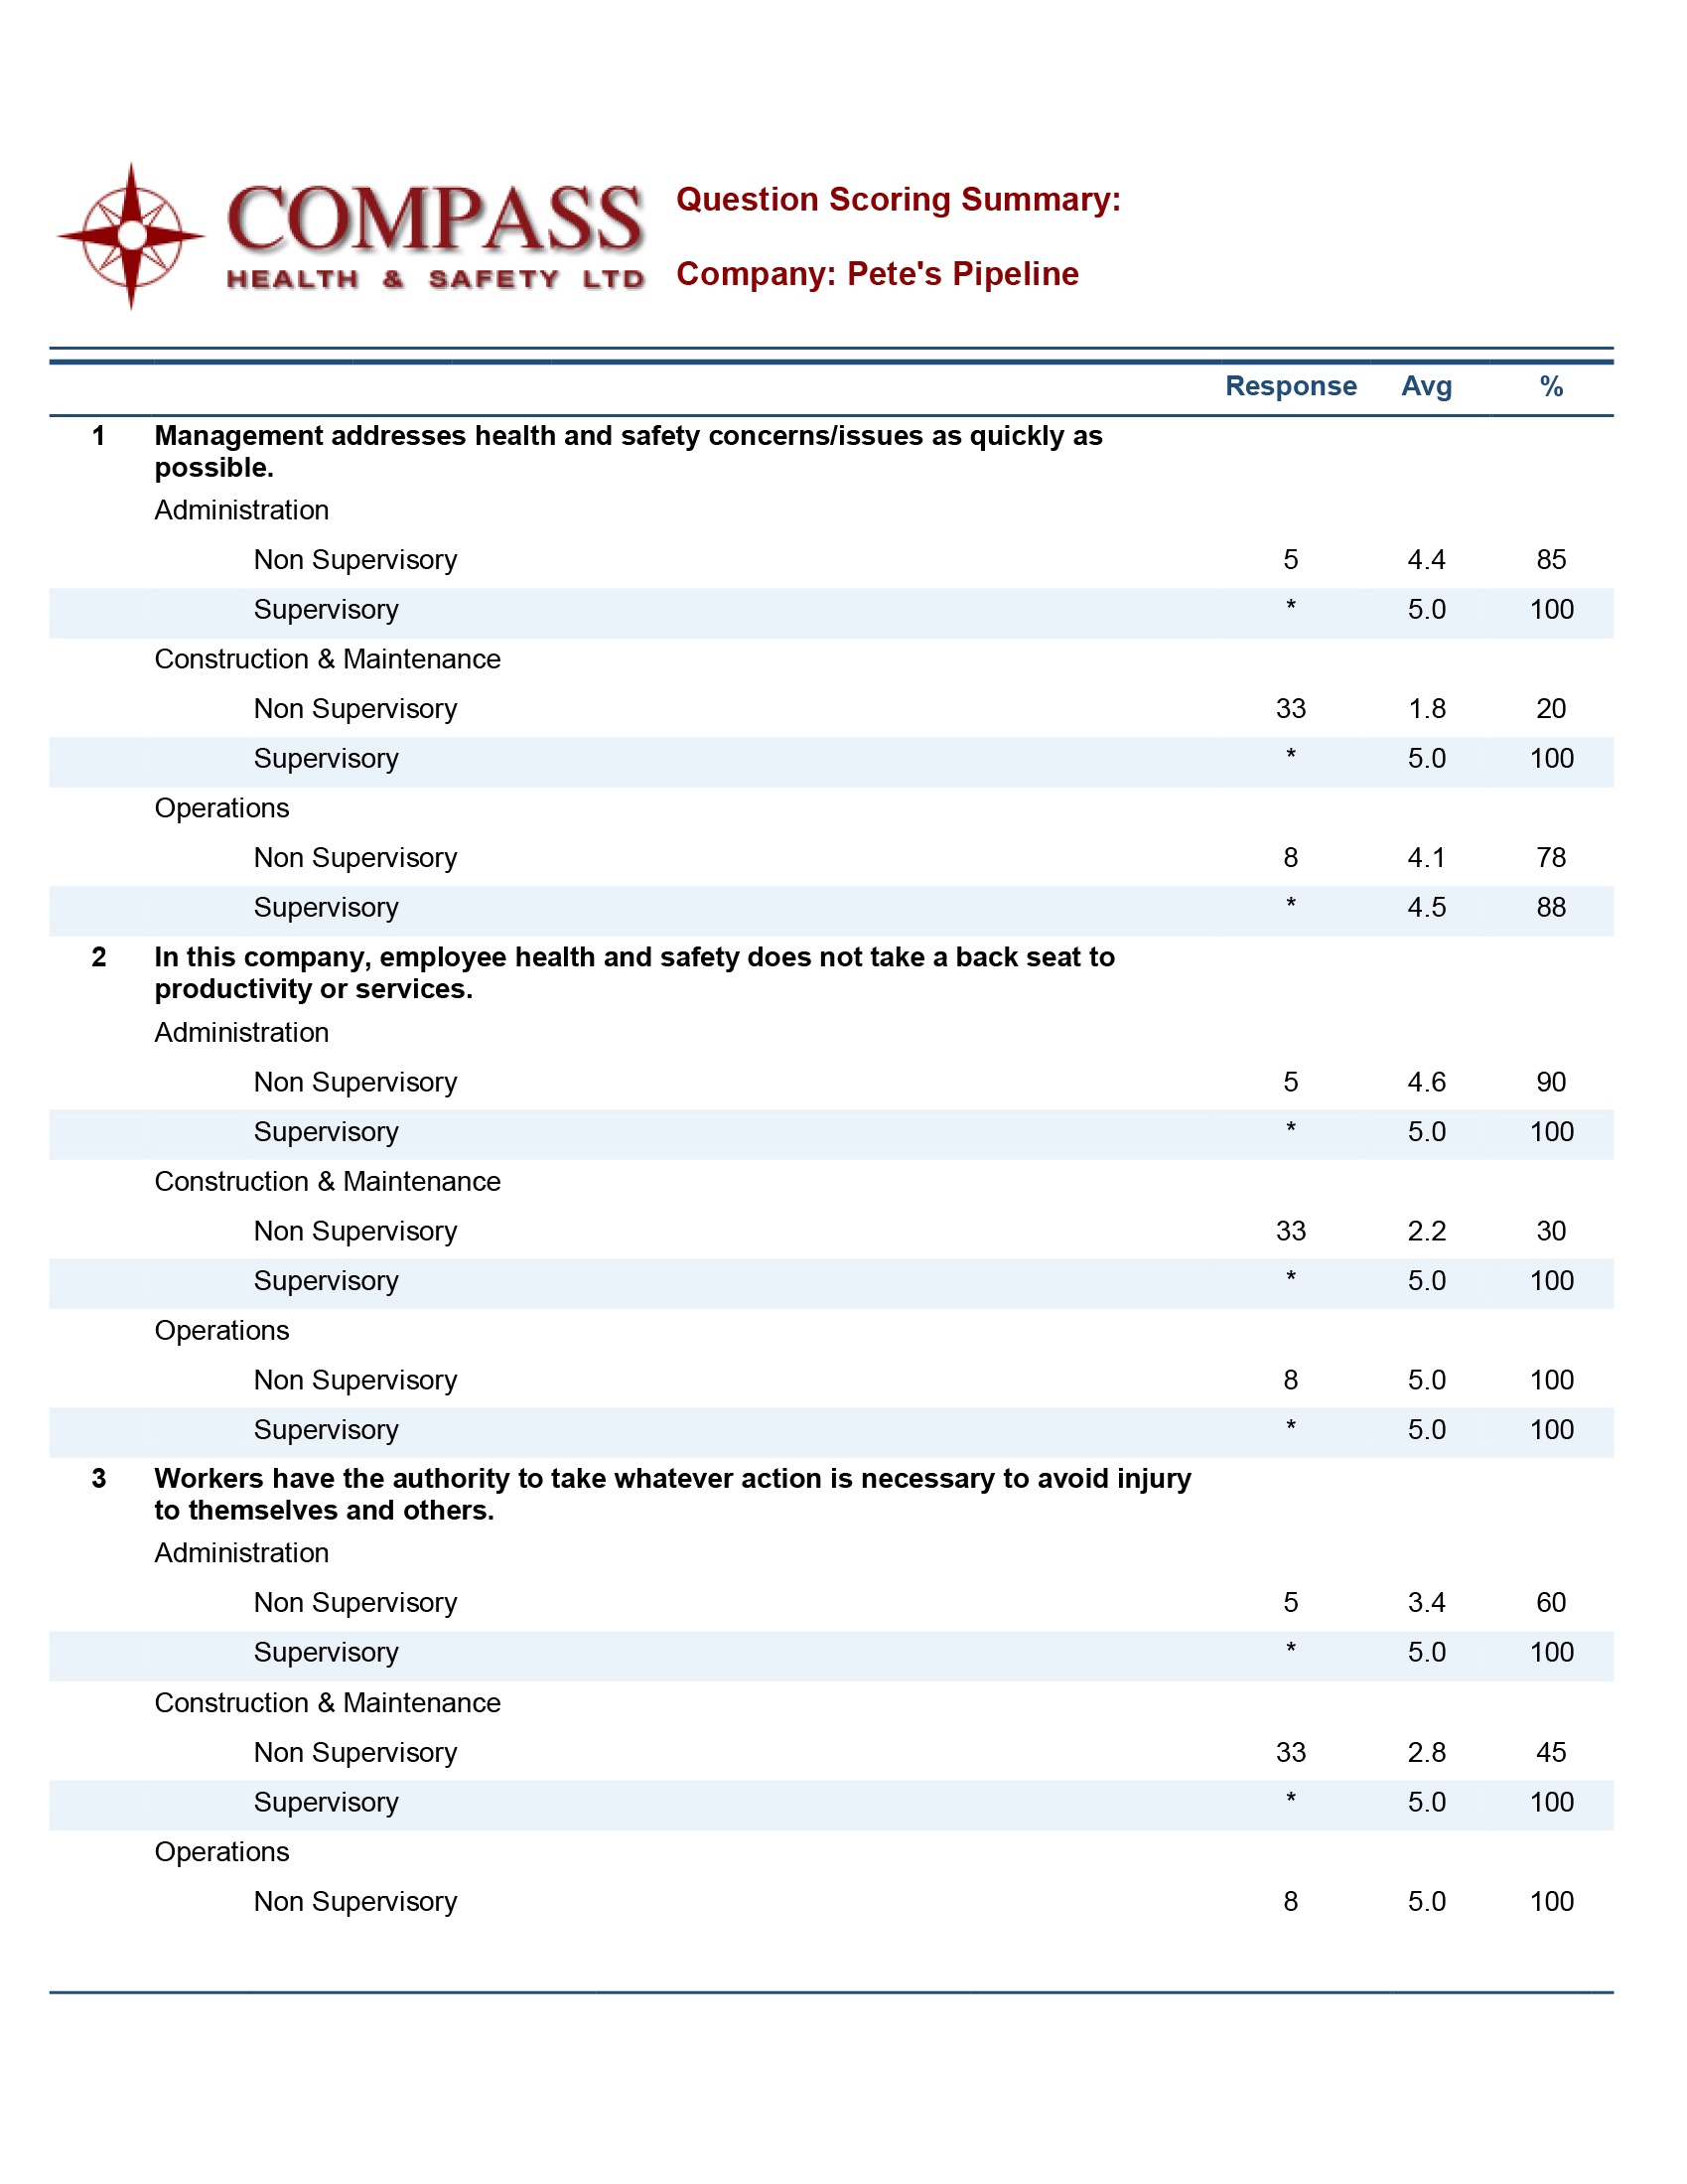
Scoring Summary
This report displays every question, number of respondents, average score by respondent and the average score expressed in percent positive. If the number of respondents for any question is so small they they will reveal how a respondent scored a specific question, an asterisk (*) is automatically displayed for the number of employees responding to the question.
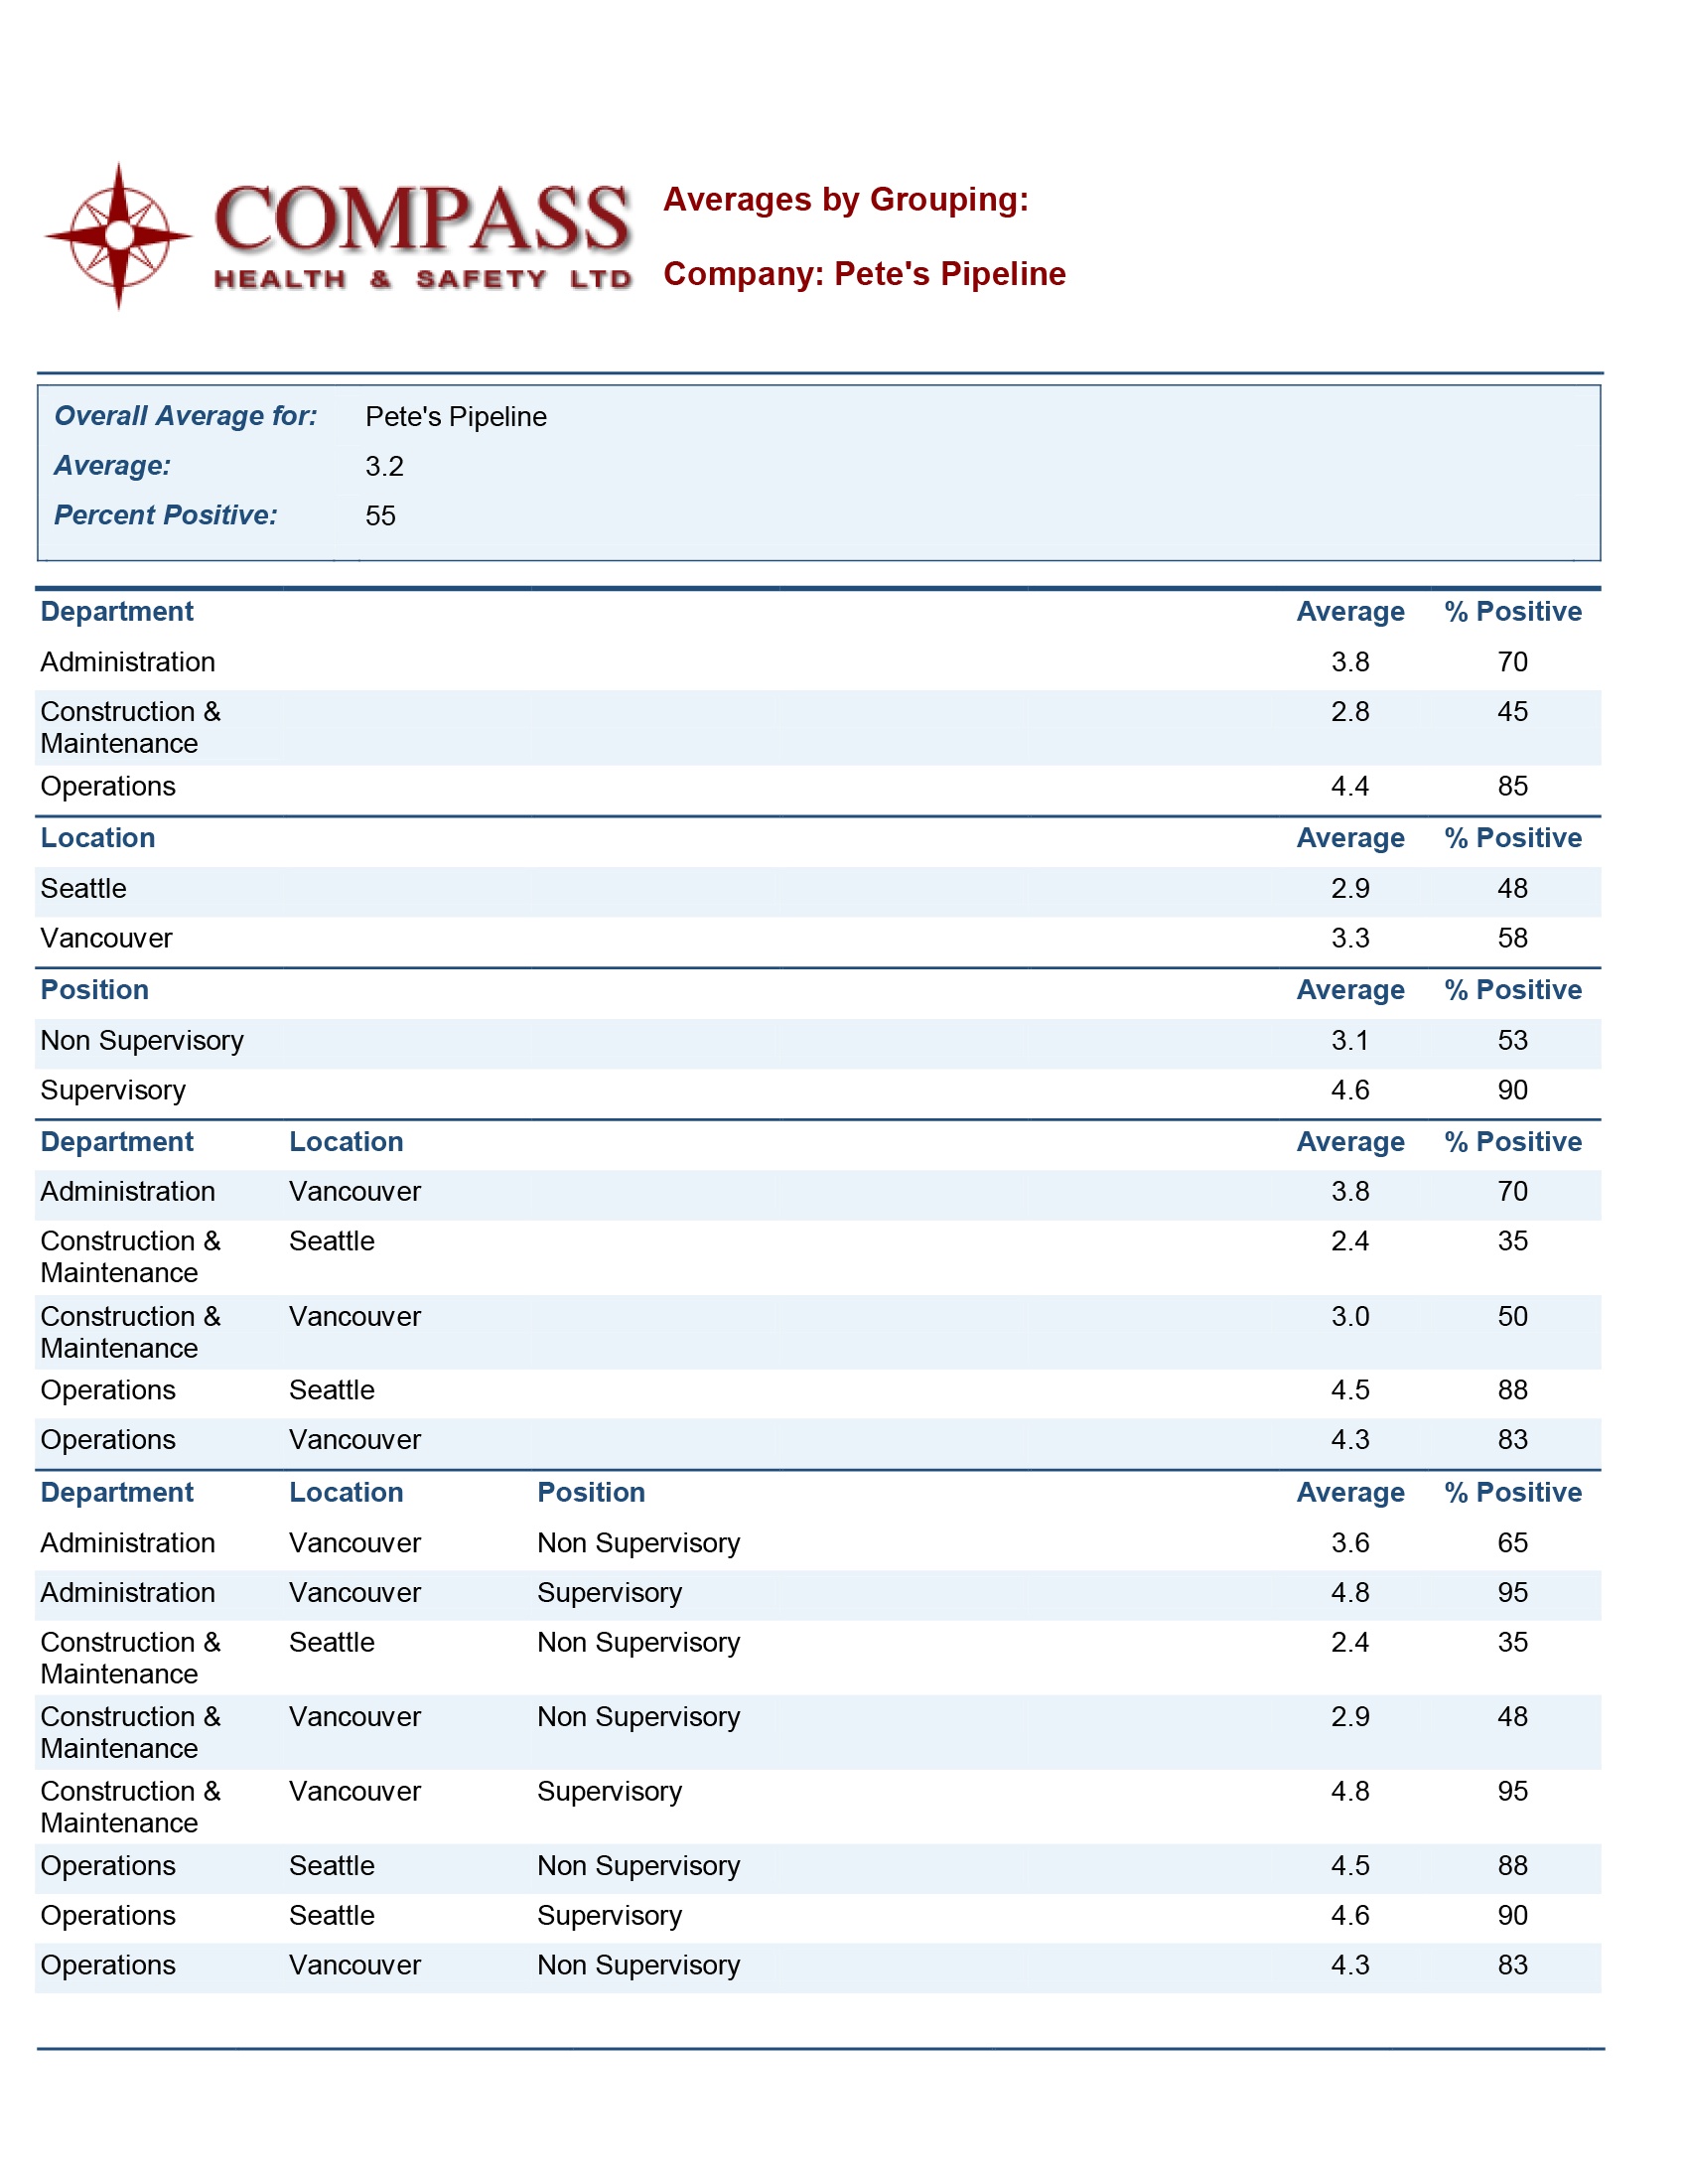
Average by Grouping Report
This report simply sorts the data into groups or by reporting parameter and displays the scoring averages.
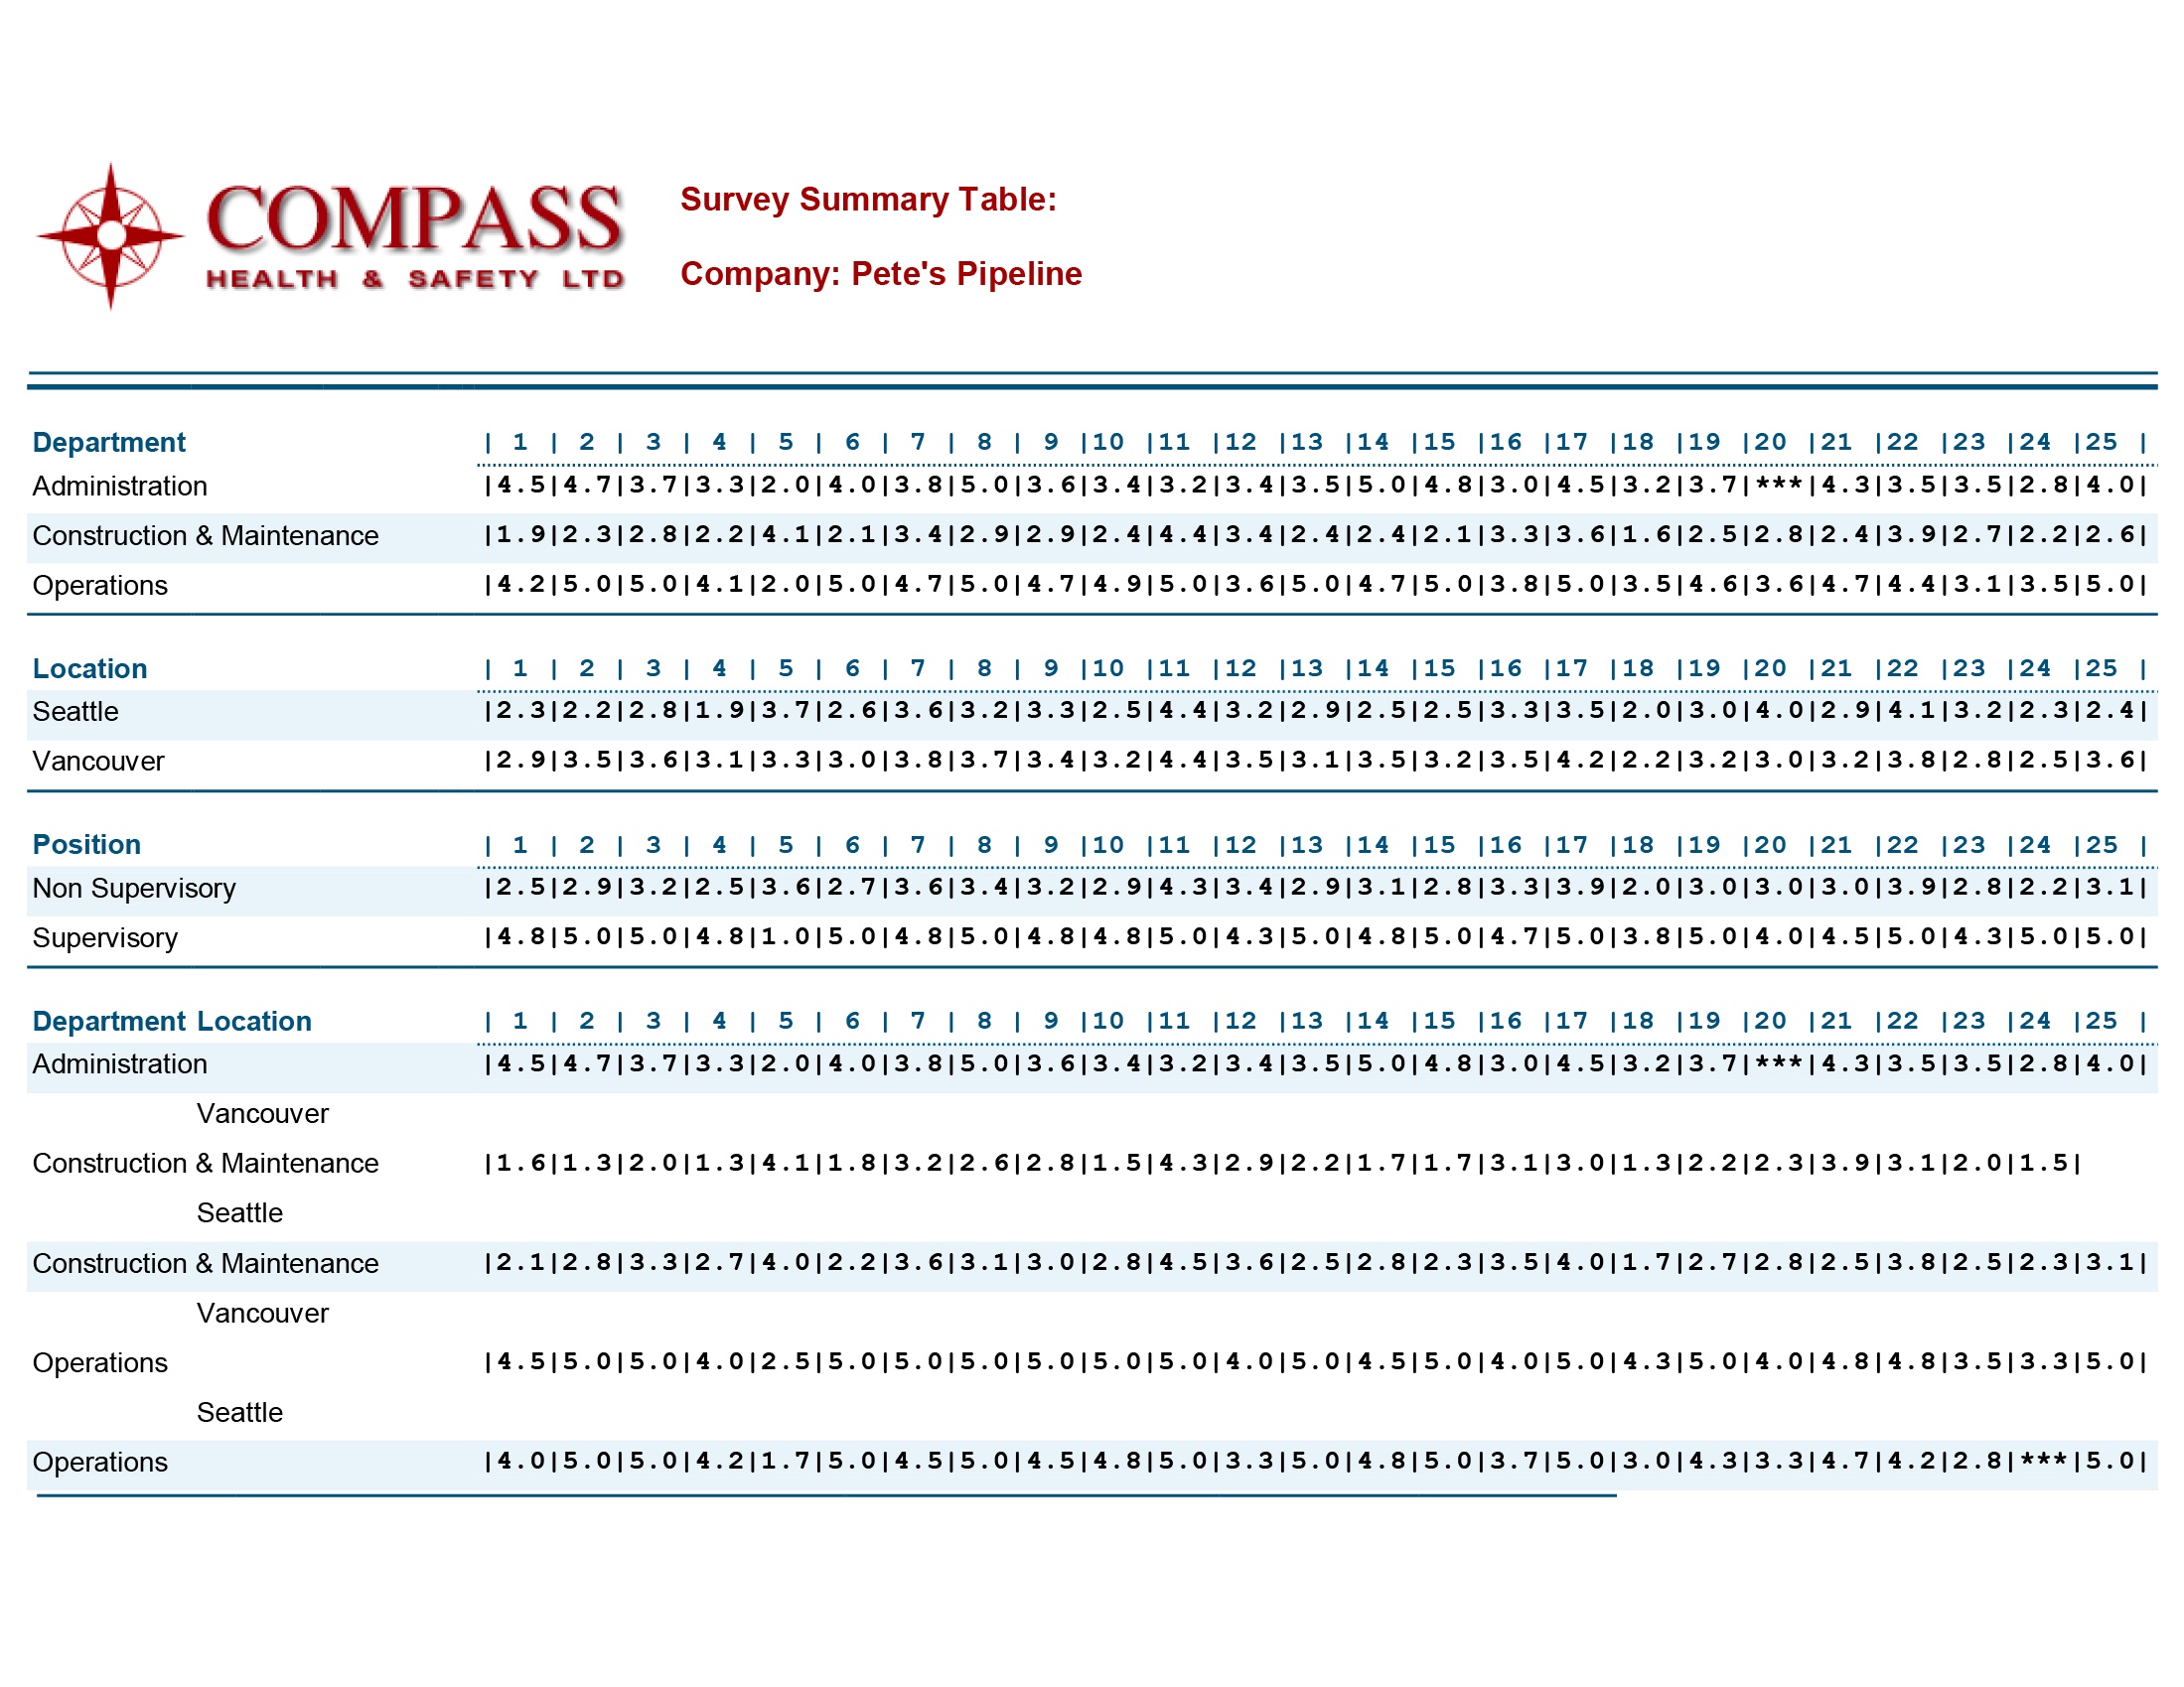
Survey Summary Report
This comprehensive report displays the data by all parameters. This report is particularly useful when analyzing all of the respondent data.
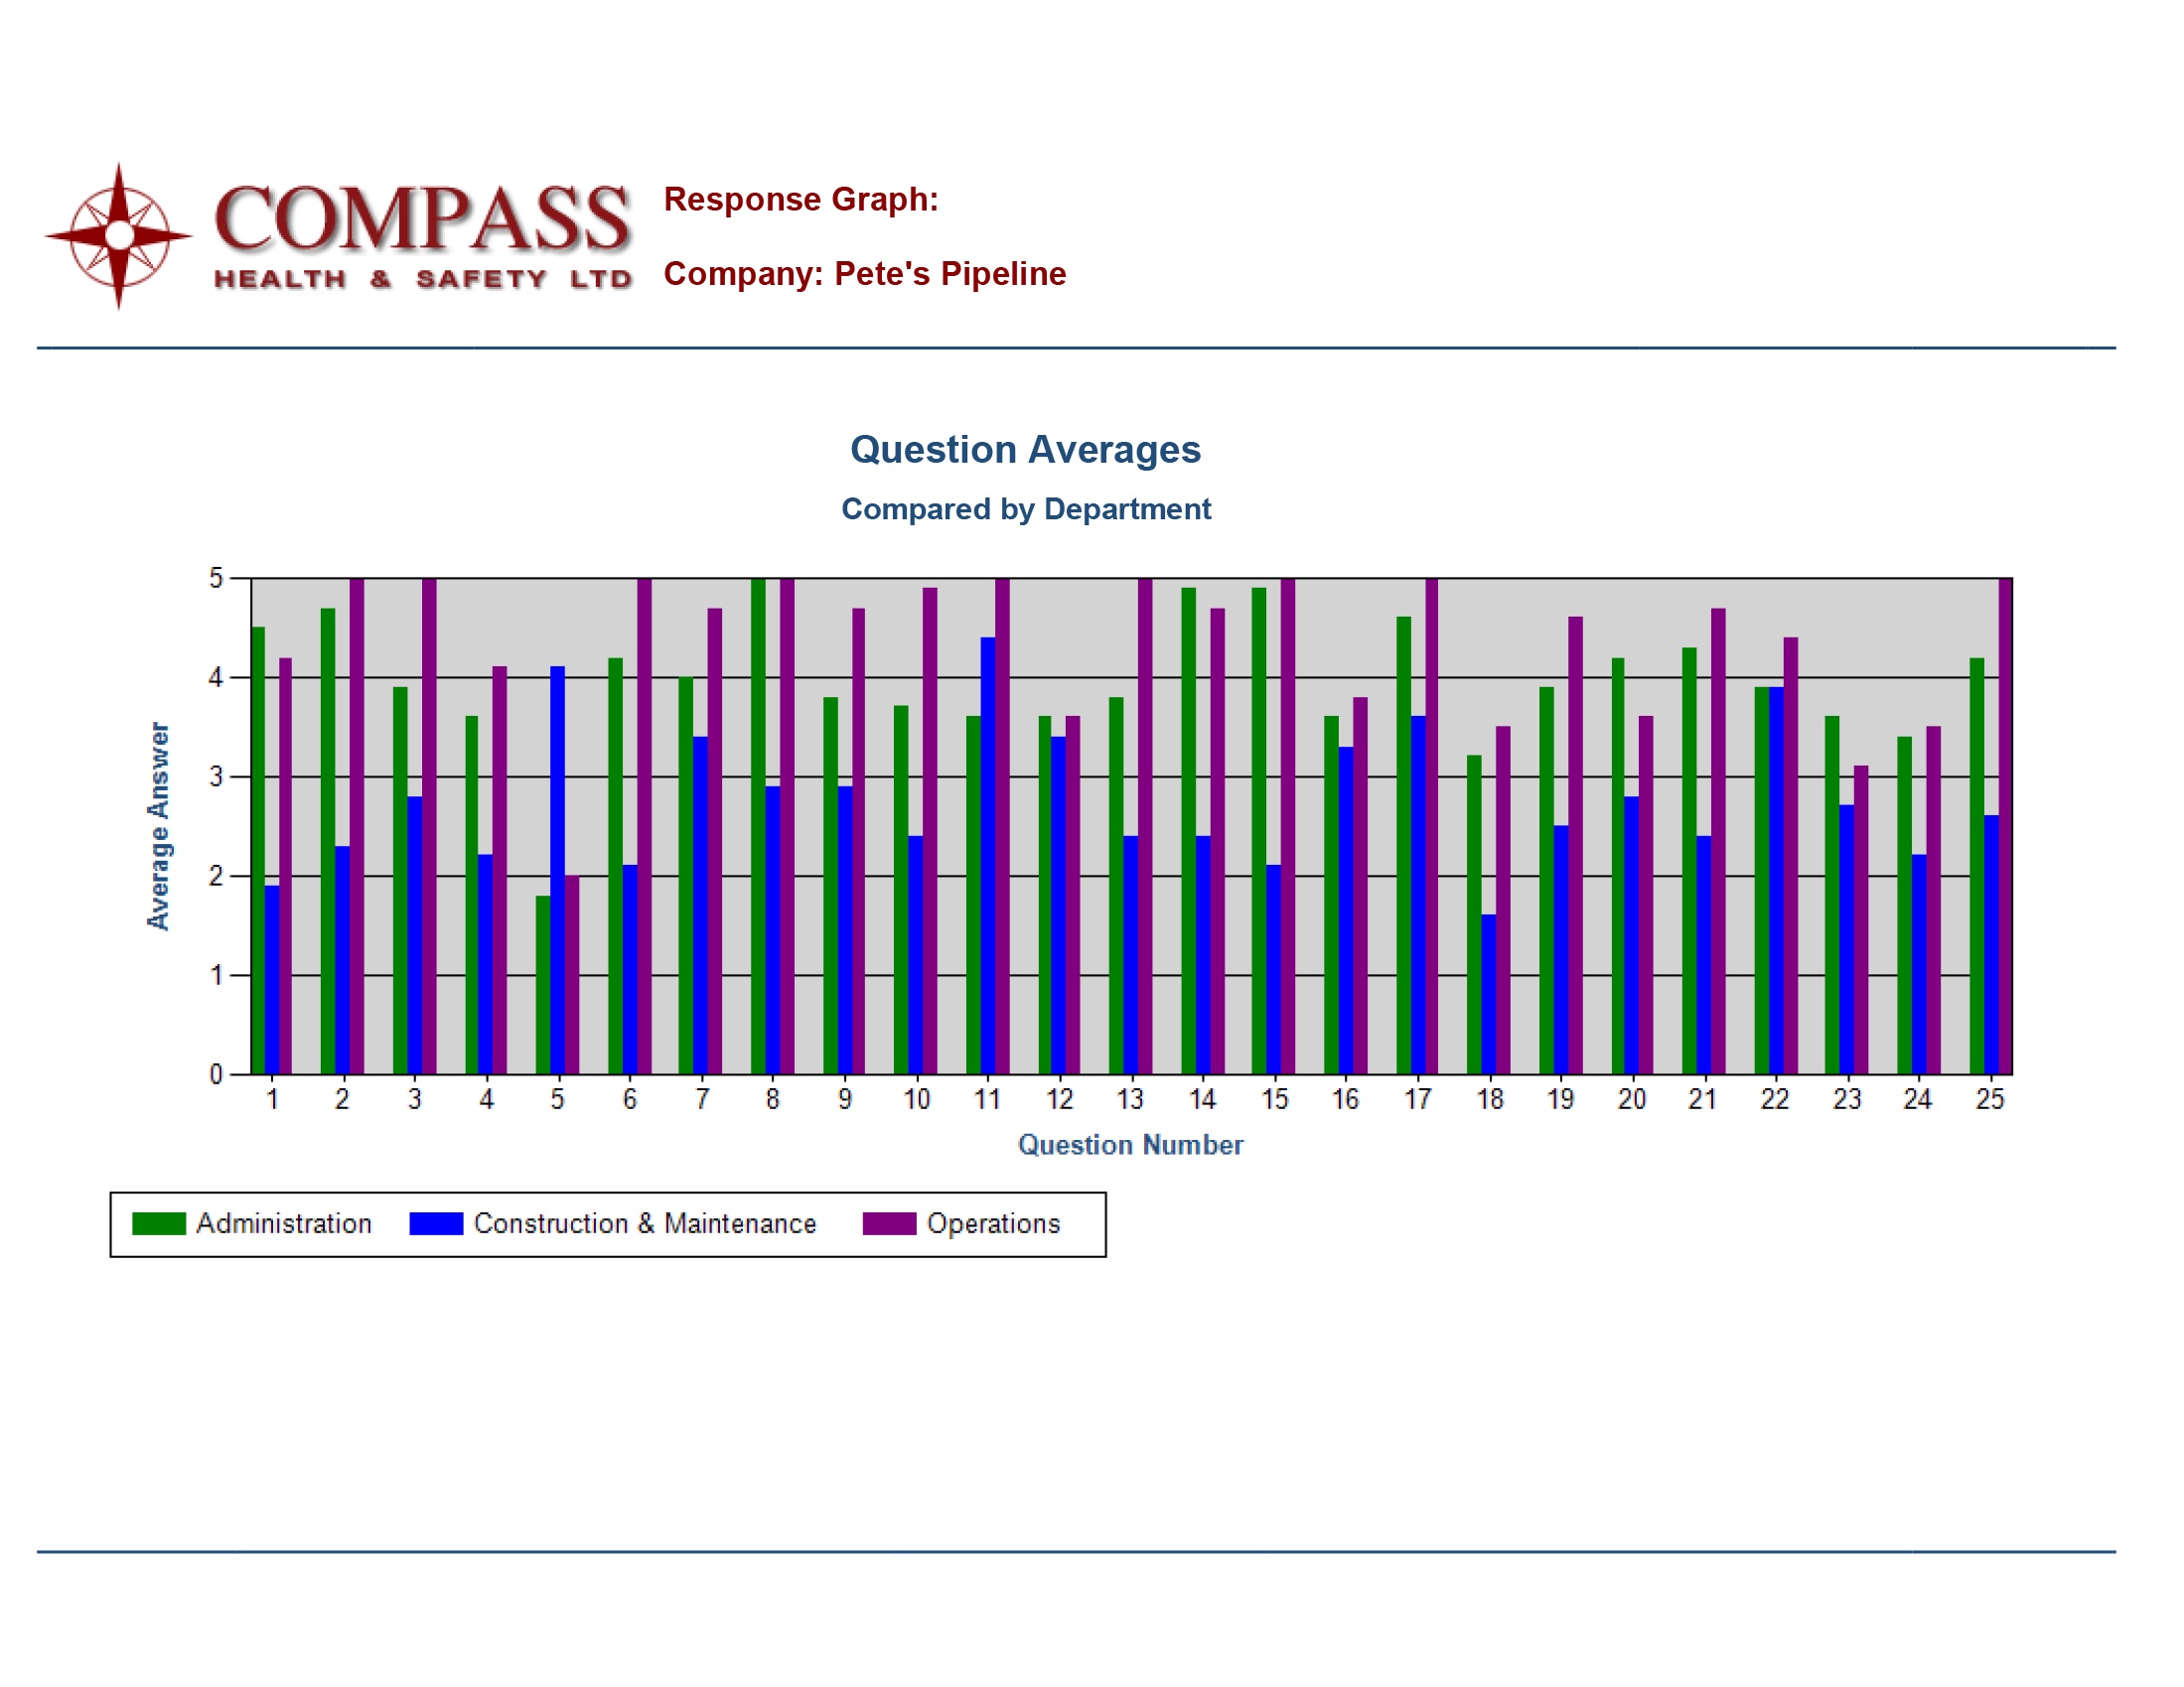
Graphs
Choose from a selection of graphing options.
_________________________________________________________________________________________
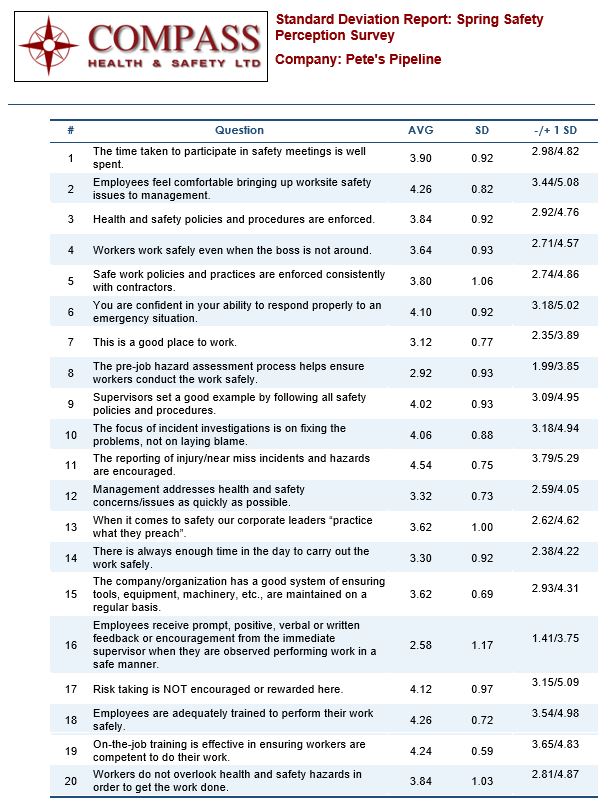
Standard Deviation Report
Benchmarking
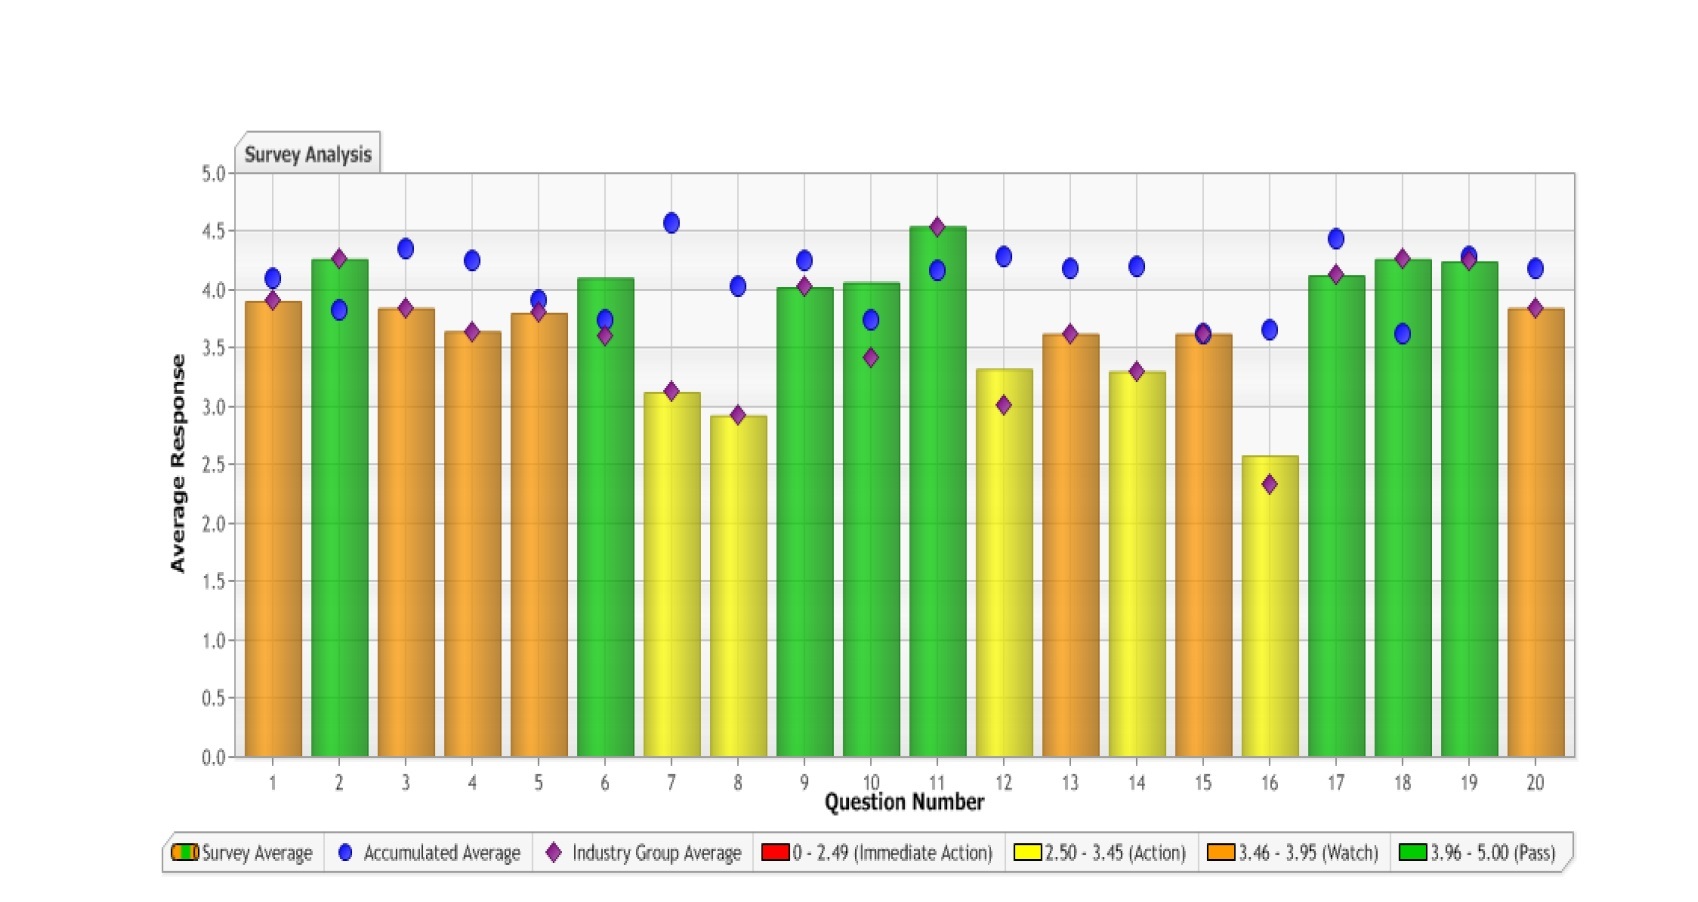
This is without a doubt one of the application’s most powerful and useful report. The Bench marking report display how your company compares against the accumulated average of the thousands of participants that have responded to a particular question. The Bench marking data is further made available to compare against your industry (e.g. construction, retail, etc.)
Another useful feature of this report is that it displays each question in your survey by colour. Red are action item questions that should be immediately resolved, yellow are action items, orange are watch items and green is considered a pass.