
Safety Management Perception Survey…..Yes, you can conduct your own
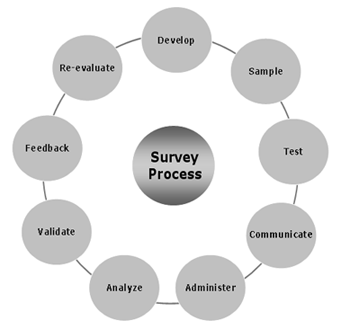
Safety Management Perception Survey Process
PROFESSIONAL SAFETY DECEMBER 2009 www.asse.org
By Dennis Ryan
A COMMON EXPRESSION IS, “If safety is not being measured, it is not being managed.” SH&E professionals know that one essential activity they perform is diagnosing the SH&E management system. They know that if they do not measure, they will not identify improvement opportunities and, therefore, cannot plan for future improvement. It follows that the measurement methods employed determine the value of the preventive information ultimately obtained. Two common measurement tools in SH&E are incident statistics and program or system audits. While these measures provide improvement information, neither provides all of the information needed to achieve world class safety. Incident statistics are limited because they focus mainly on mistakes made. Program or system audits reveal information about hard factors such as compliance, inspections and investigations, but they fall short of measuring equally important softer factors such as employee satisfaction and management trust. Even combined, the measures do not identify all key factors needed to achieve world-class safety. Few companies achieve world-class safety when the measures they use reveal so little about how to achieve it. This article describes the Safety Management Perception Survey Process. The survey process is a measurement approach that has proven useful to help companies achieve safety improvement goals.
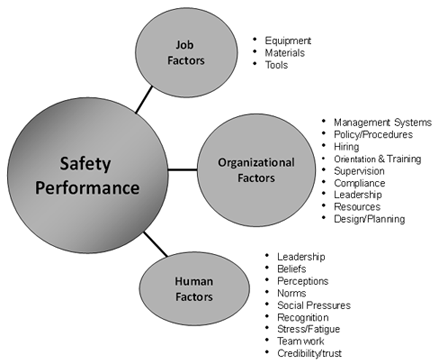
Table 1 is presented to help dispel doubts about this emphasis on corporate culture. It presents the results of a 1977-88 study described by Kotter and Heskett (1992).
Table 1
The study shows that companies with performance-enhancing cultures significantly outperform companies without such cultures. The principle applies equally well to the area of safety. Without information from employees, corporate safety culture cannot be improved. Culture is a key factor, yet many methods of safety measurement do not assess it. By contrast, a safety perception survey not only identifies the job and organizational factors that can be reasonably well identified by an audit, it also quantifies organizational and human factors that an audit typically does not measure. For this reason, a safety perception survey is valuable in identifying the factors that influence safety culture and safety behavior. When one knows and understands these factors, one can plan to achieve safety excellence.
Why Is the Perception Survey Underutilized?
Despite its benefits, the safety perception survey remains an underused measurement technique. As Petersen (2000) states, “I have no idea why safety perception surveys (to some companies) are such a hard sell.” Why, indeed? Why wouldn’t every CEO want to receive unfiltered information on corporate safety issues and potential risks? In the author’s experience, the primary reasons that a company does not use a safety perception survey are:
1) lack of knowledge about howto properly conduct a survey; and/or 2) a lack of resources to manage and report on the survey data. The keys to obtaining maximum returns from a safety perception survey are effective survey construction and administration, and a meaningful analysis of the findings. This article serves as a guidebook to help laypeople conduct and analyze their own safety perception surveys. The goal is to ensure that the perception survey measurement approach is available to anyone interested in using it.
There Are How Many Answers?
The saying “Be careful what you ask for” certainly applies to a perception survey. Imagine that a company director has 300 respondents completing a survey that contains 40 statements, each of which has five choices for the answer. That is 60,000 possible answers.As a further complication, the surveyor will likely want to analyze the data in several ways—for example, looking for specific trends by location or department. S/he may even want to group statements and responses into general categories, such as management involvement and commitment.
How can one manage so much data? A database provides the means. If a company does not have such a resource, it should not conduct a perception survey. The author once spoke with a company that did not realize until after it had administered a survey that it could not manage the data collected. With no database to aid the analysis,
the company had a large stack of completed surveys but no findings reports and, therefore, no analysis.
Will An Off-the-Shelf Survey Work?
As noted, to achieve maximum benefits from a safety perception survey, one must ask the right questions. In the author’s opinion, no off-the-shelf survey is suitable for use by all organizations. Each organization has a unique profile, with special survey design needs. One company may have a fleet or employ contractors, while another does not. One company may have a flat organization, with one location and little work diversity, while another may employ many workers in different positions and multiple locations. Some companies have visible senior management involvement,while others, based on factors such as geography, must find other ways to involve management. Some companies have implemented behavior-based safety and want to learn how employees perceive the program; other companies are a long way from implementing such a program. Because organizational profiles can be so diverse, survey statements that are appropriate for some companies may be inappropriate for others. Survey statements used need to be unique to each company. An SH&E professional should not set up the effort for failure by administering a survey not suited to the given company. A one-size-fits-all survey is a compromise, an attempt to find a common denominator that fills the needs of all companies.As a result, it often falls short of meeting the real needs of any.
- Limit each statement to one idea or concept. The following statement asks about two significantly different aspects of safety meetings: “Safety meetings are effective and well attended.” Consider breaking these queries into two different statements. Otherwise, it will be difficult to determine whether respondents scored high or low for effectiveness or for attendance, or for both.
- Avoid using subjective adjectives such as good, fair and bad.What is good or bad to one respondent may not be for another. Instead of stating, “There is good communication at safety meetings,” try “Safety meetings are effective in communicating safety issues.” This statement focuses on the real issue.
- Avoid using terms such as always and never. Such terms can force a respondent to answer more negatively than s/he normally would. For example, “Employees always bring up safety issues at safety meetings.” If 1 of 50 times they do not, the respondent must score the statement less than s/he might had the wording been, “Employees participate by bringing up safety issues at safety meetings.”
- Do not frame a statement in the negative if all other expected/desired responses are in the positive.
- If there is any chance that a term will be unclear to some respondents, provide clarification.
- Ensure that all respondents, no matter their position in the organization, have the knowledge or information they need to understand and respond to the statements presented.
- Avoid use leading statements such as, “Since the company’s incident statistics have increased substantially this year, are you satisfied our SH&E program has improved?”
No one can create good value out of responses to poorly worded survey statements. Take the time to develop good statements. Statements for management, supervisors and workers are generally the same. This allows one to assess the perception gap between these groups. It is important to know whether management agrees with supervisors and workers and to what extent. Employees should also be given the opportunity to comment on the questions or statements. Comments are valuable in validating survey scores. Without comments, it is difficult to know why employees responded as they did. Without knowing causes, one cannot be certain what actions are needed for improvement.
An appropriate scale is also important. Most surveyors use a Likert (1 to 5) scale, where 1 generally represents the least positive (or 0% positive) response to a statement and 5 represents the most positive (or 100% positive) response. Other scales are available as well, and each has its advantages and disadvantages. For example, the 1 to 4 scale does not offer a middle scoring option for employees who are noncommittal. The 1 to 6 scale provides a wider range of scoring choices, but again, has no neutral option. Choose a scale that will give the fullest meaning to the data. Less-than-meaningful scoring will lead to poor data analysis.
Next, develop the reporting parameters. These are qualifiers (such as location and employee position) that respondents select to categorize themselves when completing the survey. Typically, these parameters appear at the beginning of the survey (Figure 3).
Figure 3
The parameters must be selected carefully as they determine the different ways in which the data can be analyzed. For example, if parameters for different job positions are not included, it will be impossible to compare workers’ and managers’ perceptions. If employees are not asked to identify their location, it will be impossible to compare perceptions between employees in New York, Toronto and Hong Kong.
Step 2: Select a Sample Size
How many respondents should participate in the survey? Is it best to survey all employees or only a sample of them? There are advantages and disadvantages to each option. Including all, or nearly all, employees in the survey gives everyone the opportunity to participate. Employees may feel more involved in the safety program because they have been invited to express their issues or concerns. Another advantage of including a larger number of employees is that survey scores become increasingly reliable (valid) as sample size increases, because the potential effects of sampling error and randomness are minimized or eliminated. Finally, including more respondents results in more employee comments that will help validate each survey statement and guide the surveyor in choosing appropriate actions. However, it is not always practical to survey all employees. A corporation with 20,000 employees may not want to tackle the data-input functions associated with an all-employee survey. Furthermore, the survey report would be a large document—perhaps containing too many numbers and comments to meaningfully analyze. In such cases, choosing a sub sample of employees can be a solution. Using a sample population can result in other benefits, such as cost savings because of the reduced labor requirements to complete the surveys and input data. It has been statistically proven that a relatively small sample size can provide accurate information (Dillman&Salant, 1994). For example, a well-known U.S. polling company frequently uses a sample of about 1,000 individuals to make conclusions about the attitudes and opinions of the entire U.S. population. Studies have shown that when properly selected this sample size can provide a good reflection of the views of a large population. No firm rule dictates what sample size is best for any specific company. The determination depends greatly on the professional and financial resources available to administer the survey, and on the company’s ability to input and analyze the data.
It is a good idea to pretest the survey by administering it to a small group of employees. This validation process will help to:
-
Ensure that the reporting parameters are clear and correct. If respondents cannot easily and correctly identify such things as their location, position and division, the surveyor must either modify the reporting parameters or provide clearer directions. Mistakes here could seriously compromise later options for data analysis and reporting.
- Ensure that respondents will correctly interpret survey statements. Sometimes it is difficult to predict which words or phrases will be misinterpreted. For example, the surveyor may think it is clear that the phrase positive reinforcement means a positive verbal encounter, but pretesting may show that some employees interpret the phrase to mean something more tangible, such as receiving a safety award. Testing allows the surveyor to uncover such misunderstandings and to clarify or reword statements as needed.
- Ensure that statements are not too sensitive and will not make respondents feel that their privacy is being invaded. For example, statements on drug and alcohol use may fall into this category. A question that respondents may relate to a recent catastrophic event, such as a fatality,may also be too sensitive for some individuals and they may resist responding. Administer the pretest as though it were the actual survey. Afterward, ask respondents whether the survey seemed straightforward. Then, carefully review the answers to each statement to learn whether the survey is eliciting the desired information. Modify it as needed, then re test with a different sample group.
Employees generally do not appreciate surprises. For the survey to be positively received, communicate the plan to all employees in advance. This communication should cover the following points:
- purpose of the survey and what the company hopes to achieve by administering it;
- authority under which the survey is being administered (for example, if the president has approved it, say so);
- request for participation;
- confidentiality protection measures that are being taken to ensure anonymity;
- what will be done with the results;
- how the findings will be communicated to the respondents.
Once employees have been told about the survey and have learned why their participation is important, it is time to administer the survey. This can be achieved in several ways, and eachmethod has pros and cons.Methods such as telephoning and mailing are less successful for obvious reasons. Not only are employees being asked to spend their own time completing the survey, but the surveyor is competing with the numerous other surveyors using these approaches.The author has had success using the Internet for these surveys. Employees like being able to complete their survey at any time, from any location. However, the best successes with survey administration occur when employees are assembled in meeting rooms and asked to complete the survey anonymously on company time. Groups of employees may be called to the survey room at a designated time, or the task can simply be made part of a regular staff/safety meeting. If the survey is administered during a meeting, it is best to have someone other than the employees’ manager or supervisor administer it. If possible, recruit representatives fromanother plant, branch or location for the task. Select someone to whom employees will feel comfortable giving their completed surveys. All completed surveys should be placed in individual, nonlabelled envelopes, or in one large envelope placed at the meeting room exit. Demonstrating a respect for anonymitywill generally prompt truthful answers. If the workforce is diverse, some language barriers or literacy issuesmay arise. If the number of such employees is significant, have the survey translated into their native language. However, take care to ensure that the translation does not change the intent of any statements. If only a few employees need help to complete the survey, have a qualified interpreter work with them.
Step 6: Analyze
Once the surveys are completed, how should the company handle the data? Table 2 shows a typical treatment of survey data. It sorts the data according to the survey’s reporting parameters, and also presents a sample of the comments received. By correlating the scores with the comments, one can immediately see the benefits of including comments in a survey.Without comments, the data show only that some groups of respondents scored high and some scored low, but they offer no insight as to why this occurred. Often, scores alone will not provide the direction needed to take specific action. Comments can provide that information. However, in some situations, comments can reveal more than desired. Under the cloak of anonymity, employees may make disparaging statements. Some employees may view the survey as an opportunity to criticize the boss with statements such as “the supervisor is an idiot.” Provided only a few such comments are received, they can be considered as a variance. The surveyor may choose to exclude such comments fromthe final report, as the ultimate goal is analysis, not entertainment or revenge. Based on the information presented in Table 2 &3, here’s how a surveyor might analyze the situation at the Calgary branch of ABC Utilities Ltd.:
Table 2
Table 3
1) The administration, nonsupervisory group clearly does not believe that safety is given a high priority. Some reasons are listed for this perception that ABC should address.
2) The perceptions of the administration, nonsupervisory and supervisory groups appear to be disconnected. The nonsupervisory group scores the question at 1.4, and the supervisory group scores it at 3.7. This perception gap suggests that the two groups are not aligned in their thinking relative to this statement.
3) The construction, nonsupervisory group scored the question at 2.3, and its comments, like those from administration, indicate that this group believes the company is running too lean. Supervisors, however, generally agree with the statement, scoring it at 3.5. This difference in scores and comments reveals a perception gap between the supervisory and nonsupervisory groups in construction.
4) Close alignment exists between the operations supervisory and nonsupervisory groups, which strongly suggests that in this group safety does not take a backseat to service.
Step 7: Validate
If the safety perception survey is designed according to the approach detailed here, the comments received will generally serve to validate the scores. However, at times, comments may not provide enough information on what employees feel should be done. In these cases, focus groups can help the surveyor gather the extra data.
A focus group is a small group of employees who are trusted by and have credibility with fellow employees. The group’s primary purpose is to review the findings, validate them if necessary (perhaps via interviews) and provide input into the action plan. The group may include members of the safety committee, union representatives and/or safety coordinators. Choose group members who can communicate with each other and work together, and select a group leader who can keep discussions on target. Larger companies may find it beneficial to set up multiple focus groups, each dealing with survey data specific to a given location or area. Alternatively, employees can be invited to provide feedback through the company intranet or website. This input can then be used to further qualify survey comments. This approach achieves the same end as focus groups without the cost of holding meetings. However, it requires one or more dedicated computers that employees can use to respond anonymously to focus questions. Employee time will also need to be made available for the activity. This approach is cost-effective and nonthreatening. However, if employees are allowed to volunteer for this role, those who come forward may have an agenda other than corporate improvement. Therefore, participants should be selected at randomand allowed to provide further information on company time.
Step 8: Feedback
After the survey is administered, employees will want to knowthe results.Avoid overwhelming them with reams of detailed findings that can lead to misinterpretation. For example, if workers read detail in the report that implies management is lacking in involvement, they could conclude that a manager is not involved or committed to employee safety and health.However,what if thatmanager scored high in other areas of commitment, such as in conducting investigations? S/he could stand wrongly accused. Instead, provide an easy-to-understand summary and indicate that the full report is available on request. If an employee asks to reviewthe full report, the surveyor may want to guide this individual through the data. Another effective means of communicating survey results is to release a short newsletter outlining key strengths, opportunities for improvement and action steps. Through whatever means possible, keep employees up-to-date on the actions that the company is taking or planning to take in response to the results. And action must be taken. Experience has shown that conducting a safety perception survey creates a strong expectation that action will follow. Employees take the survey seriously and expect to see results. If they are disappointed, itmay be difficult to get their cooperation on future surveys or on other SH&E initiatives. Employees will feel disillusioned and betrayed.
Step 9: Reevaluate
The safety perception survey yields information about a company’s SH&E management system that other measures do not. Unless a company has already achieved safety excellence, the perception survey will likely reveal many improvement opportunities. It can often take a companymore than a year to plan and execute all of its responses to the survey findings. Therefore, such a survey should not be conducted too often. Most companies conduct a survey every 1 or 2 years. Alternatively, large companies may survey different locations or departments on a rotating schedule.
Conclusion
Employee opinions and perceptions play a key role in any organization’s success. As companies recognize that their stakeholders have solutions to many issues, they are seeing the value of soliciting opinions and perceptions from employees, customers and constituents. Safety is no different. Many factors that affect quality, productivity and service also affect safety. A safety perception survey is a key tool for understanding these factors. Too often, a company can be lulled by its measurement systems into thinking its safety systems are fine, only to experience a catastrophic event. To make a workplace safe, management must know what employees are thinking. If the culture fosters unsafe behaviors and procedural shortcuts, a perception survey will help uncover why. If the culture influences employees to work safely even when the boss is not around, a survey can help to maintain this high level of safety.
Can anyone really conduct a perception survey?
Yes. Based on the author’s experience, by following the steps outlined, an organization can use a safety perception survey to evolve more positive safety perceptions and create more positive safety attitudes and behavior. Uncover the issues and solutions, act on that knowledge and a world-class safety system is within reach for any company.
This article is also available through ProQuest using this link: http://search.proquest.com/openview/53ea3c0468f17dc1aaa42859f5576fa7/1?pq-origsite=gscholar&cbl=47267
We Can Help
Compass Health & Safety Ltd. specializes in helping organizations conduct their own safety perception surveys. We have written a “how to” book on the subject which is for purchase in our website products section. We have a powerful web based survey application that we make available to organizations so that they can manage their survey data and report the findings. We are available to advise our clients step by step on the safety perception survey process. Contact us for more information.
References
Bailey, C. & Petersen, D. (1989, Feb.). Using perception surveys to assess safety system effectiveness. Professional Safety, 34(2), 22-26.
Dillman, D.A. & Salant, P. (1994). How to conduct your own survey. New York: John Wiley & Sons Inc.
Johnson, D. (2003, Oct. 3). Perception is reality. ISHN E-News, 30(2). Kotter, J.P. & Heskett, J.L. (1992). Corporate culture and performance. New York: Free Press.
Mansdorf, Z. (1999, May). Organizational culture and safety performance. Occupational Hazards, 61(5), 109-112.
Molenaar, K., Brown, H., Caile, S., et al. (2002, July). Corporate culture: A study of firms with outstanding construction safety. Professional Safety, 47(7), 18-27.
Petersen, D. (2000, Jan.). Safety management 2000: Our
strengths and weaknesses. Professional Safety, 45(1), 16-19.
Petersen, D. (2003). Techniques of safety management (4th ed.).
Des Plaines, IL: ASSE.
Rea, L.M. & Parker, R.A. (1997). Designing and conducting
survey research: A comprehensive guide (2nd ed.). San Francisco:
Jossey-Bass.
Ryan, D. (2001, Fall). Measuring your health and safety management
system. CSSE Contact.
Ryan, D. (2002, Winter). Corporate safety culture: A determinant
of program effectiveness. CSSE Contact.
Ryan, D. (2006, Spring/Summer). The missing piece of the
occupational health and safety puzzle. CSSE Contact.
Shaw, A. (1998). Moving to the new way of measuring OHS
performance. Sydney, NSW: NSW Minerals Council.
Sheppard, A. (2001, Sept.). The perception survey: Measuring
the intangibles in workplace health and safety. Occupational Health
& Safety.
Stewart, J.M. (1999). Managing for world class safety. Malden,
MA: Wiley Interscience Inc